Where are all the Enforcers?

In this Edition
- What is an Enforcer?
- What Statistics Can We Use to Define an Enforcer?
- What is the Enforcer Index?
- Walkthrough: Creating Social Content from Enforcer Stats
What is an Enforcer?
In hockey, the enforcer is a term used to describe a player whose primary role is to intimidate and physically challenge opponents rather than to score or assist in goals (though there are exceptions that are considered enforcers but have a high point production rate). This type of player is usually known for aggressive behavior, including fighting and body checking. The enforcers protect their teammates from rough play by the opposition and have been colloquially known as "goons" – though to some this is considered derogatory.
When we were growing up playing hockey, the enforcer was an important part of the game. They were generally bigger and tougher than most of the players, so you never wanted to find yourself in the corners alone with them. And if you did happen to forget there was an enforcer and were to go after the opposing team's star, well, you'd get a pretty quick reminder. So, from this perspective they kept the peace.
Enforcers have come and gone in the NHL, but below are a sampling of some of the enforcers we grew up watching.
One of our favorites on this list is Terry O'Reilly, and if you want to see how crazy the enforcing could really get, then check out this YouTube video. We won't give away the ending, but maybe a lesson here for the more rambunctious fans out there.
What Statistics Can We Use to Define an Enforcer?
To determine whether a hockey player is an enforcer, you might look to statistics such as:
- Penalty Minutes (PIM): This is a telling statistic. Players who accumulate a high number of penalty minutes are often involved in physical or aggressive play. Enforcers tend to have higher PIMs compared to other players.
- Fights: The number of times a player has been penalized for fighting. Enforcers typically engage in more fights than the average player.
- Hits: Although a high number of hits doesn't necessarily indicate a player is an enforcer, players who play a physical game often have higher hit counts.
- Points (Goals and Assists): Enforcers typically score fewer points compared to other players, as scoring is not their primary role on the team.
It's important to note that the role of the enforcer has been diminishing in modern hockey. The game has been shifting more towards skill and speed, reducing the emphasis on fighting and physical intimidation. (Notice we didn't say the game is devoid of cheap shots.) As a result, the traditional enforcer role is less prevalent than it was in the past.
What is the Enforcer Index?
There isn't an officially recognized or widely used statistic that measures enforcers. However, the concept of an Enforcer Index is a hypothetical (and fun) statistical tool to quantify a hockey player's tendency towards behaviors traditionally associated with an enforcer.
The Enforcer Index could take into account the aforementioned statistics, PIM, total fights and total hits, and perhaps include total points scored as an inverse measure – all to calculate a score that represents a player's "goon-ness." The score could be scaled, for instance, from 0 to 100, where a higher score indicates a greater propensity for the behaviors associated with enforcers.
We created an Enforcer Index by calculating a physical metric (PIM, Fights and Hits) and a scoring metric (Points) – subtracting point production from the physical stats. The higher the index, the more likely the player is to be physical, and the lower the index the more likely the player is to be a scorer or playmaker. The index will also reveal players who are enforcers, but also accumulate points.
Note that we added weights for Fights and Points – with a higher weighting on Fights. And in the final list (after we calculated the Enforcer Index), we filtered on those players who had played more than 40% of the season.
The below represents our Enforcer Index.
Enforcer Index = (PIM + (Fights * Weight) + Hits / GP) - (Points * Weight/GP)
The below chart resulted from calculating the Enforcer Index for every player and then taking the top twenty 'enforcers'.
In this edition, we wanted to cover a topic we're passionate about, but haven't yet covered: leveraging hockey statistics and analytics on creating social media content or content for sports journalism. So, in this week's walkthrough, we'll focus on one aspect of our data and create content for social media.
Walkthrough: Creating Social Media Content using Enforcer Stats
Some of the best hockey stories are based on facts and statistics, but how do you go from stats to content that goes viral on your favorite social media platform? In this walkthrough, we'll use our Enforcer Index ranking, take the top enforcer and will create an example of social media content using a few key ingredients.
The walkthrough comprises three steps:
- Source the stats data
- Mock up the design
- Create the content
Source the Stats Data
For this newsletter edition, we created a dataset that includes various player statistics that you can use to calculate the Enforcer Index. You can download the dataset from here.
When you download and open the file, you should see something similar to the below. (We've formatted the data as a table to make sorting easier in Excel.)
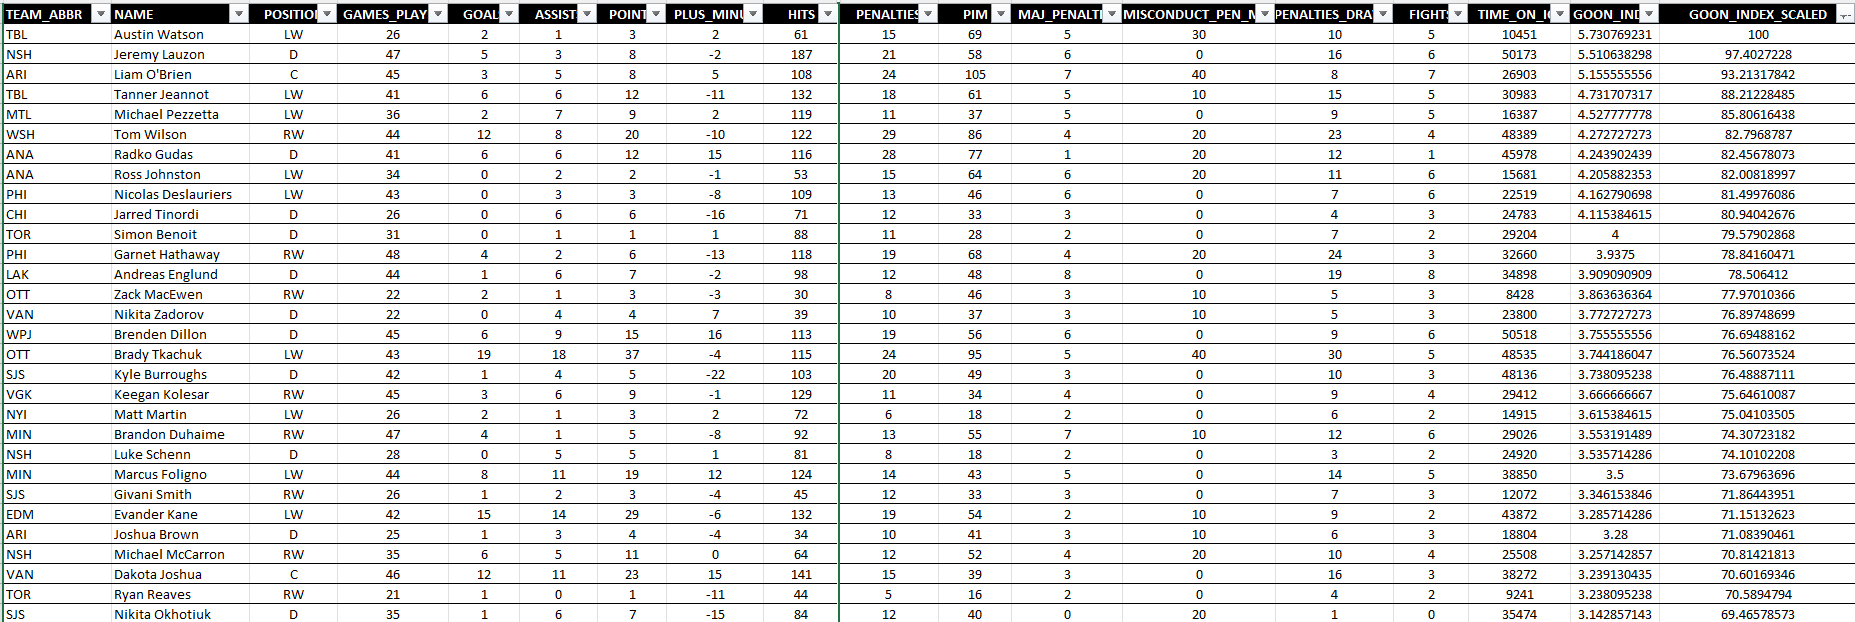
Per the Enforcer Index formula we discussed earlier, the data we'll use is below:
- TEAM_ABBR
- NAME
- PIM
- FIGHTS
- HITS
- GOON_INDEX_SCALED
Using our Enforcer Index calculation, Austin Watson (at the time of our data pull) came out to be the top enforcer. So, our story will center on him being the NHL's top enforcer.
In the CSV, you can sort the GOON_INDEX_SCALED column in descending order and take the first row. After you hide the data you won't use for your content, you should be left with the following data.

We can now move on to the design.
Mock up the Design
The content we're creating is to highlight the top enforcer, so your design should be tough, gritty and mean – but do it in a fun and cool design. For our design, we used the following ingredients:
- The enforcer stats data (Team, Name, Hits, Fights, PIM, and Enforcer Index)
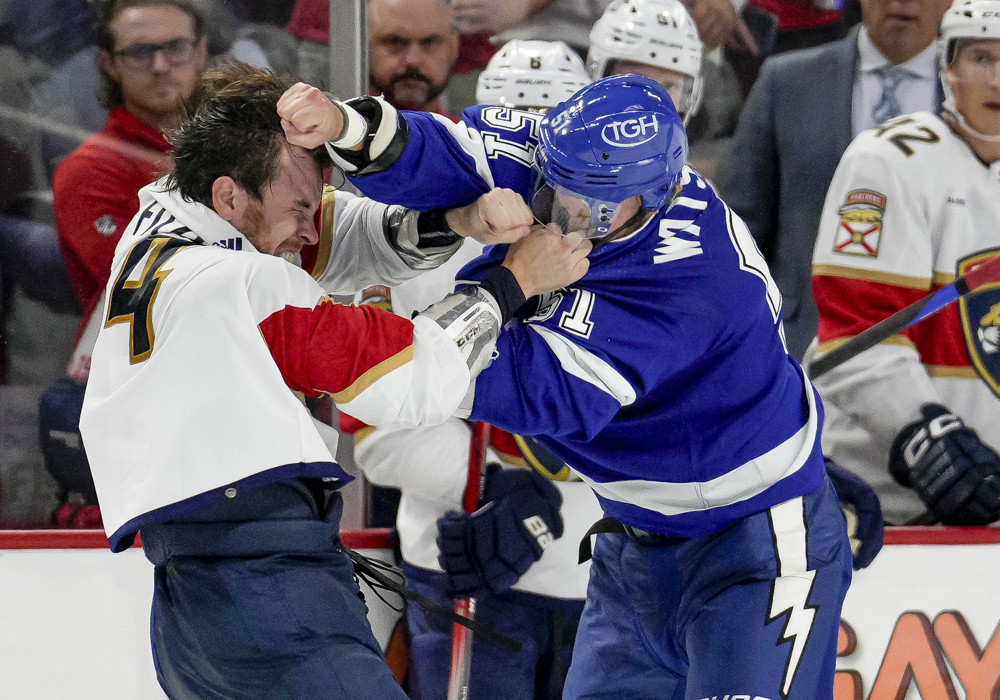
- A photo of Austin Watson fighting
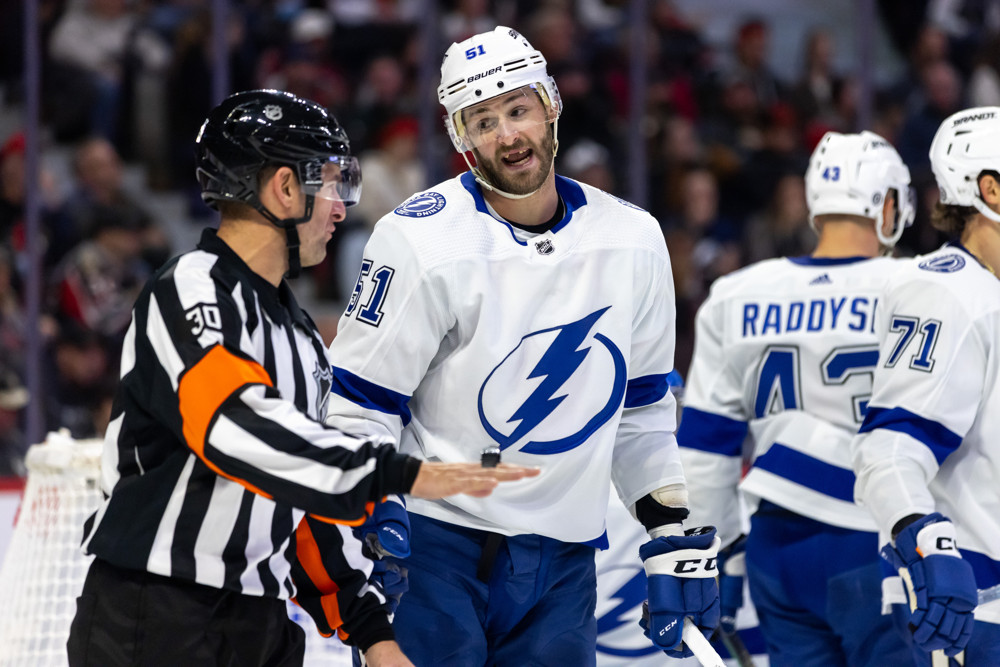
- A photo of Austin Watson speaking to a ref
- An image of a tough-looking hockey player with blood on his face
Below are the three images referenced above. (The first two were licensed from Icon Sportswire, and the third was sourced from Midjourney.) We wanted to use the Austin Watson images as foreground images to represent Austin's 'enforcer-ness' and the tough-looking hockey player image as more for background texture.
Austin Watson exchanging words with the ref
Austin Watson in a fight
Tough-looking hockey player with blood on his face

We use different design tools such as Figma, Canva, Balsamiq, Miro, and PowerPoint, depending on what we're trying to do. For this project, we wanted a quick and dirty mock-up so we used PowerPoint.
To create a mock-up design in PowerPoint (using images like we have here):
- Open PowerPoint
- Click Insert, Pictures, This Device and navigate to the photos you want to add to the slide and click Open
- Arrange the photos on the canvas in the design that you want along with where you want the stats located
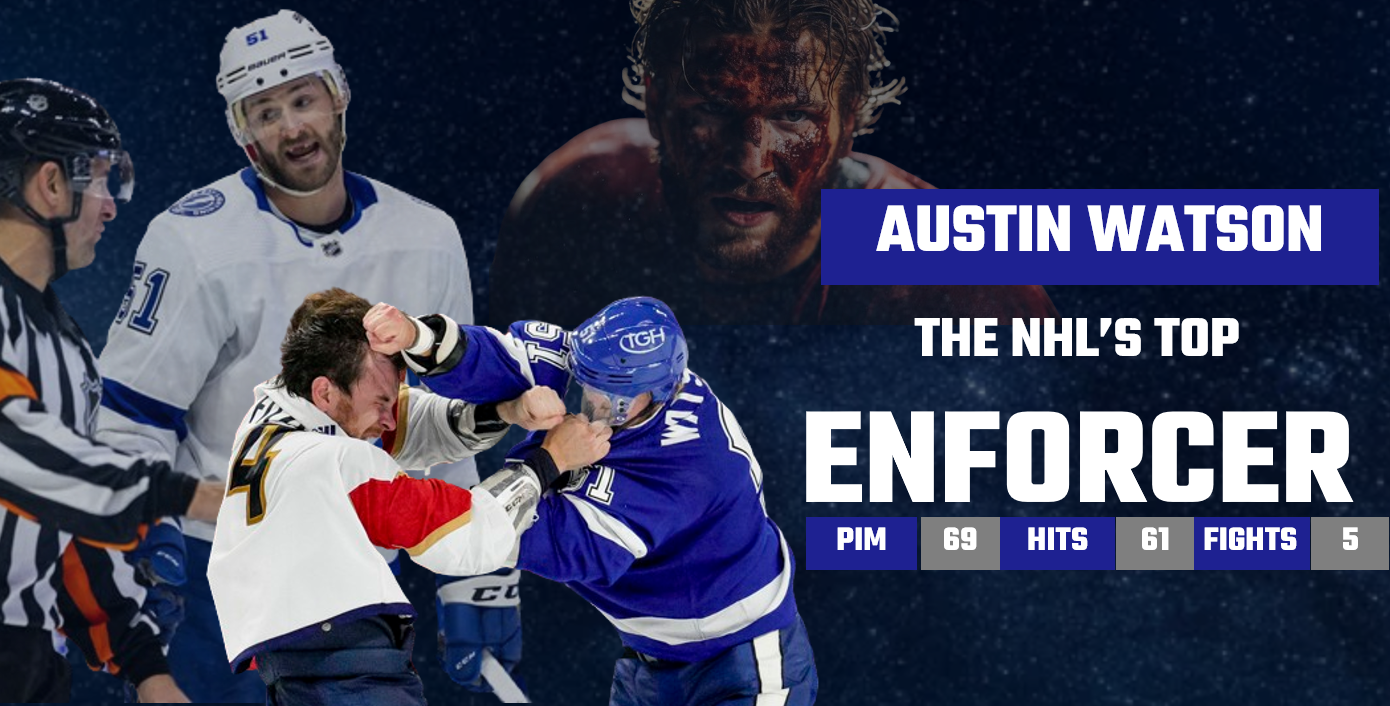
If you're not a designer, don't worry. PowerPoint can recommend designs for you. For example, the below was a first draft without any image editing with PowerPoint recommending a design.
With a bit of clean-up (e.g., more transparency, texturized background, improvements on text presentation, etc.), you can continue to evolve the design 0f the content and actually get to a somewhat decent piece of content.
Now at this point, you can choose to take one of two paths: 1) you can continue to work on the design yourself or 2) you can work with a designer.
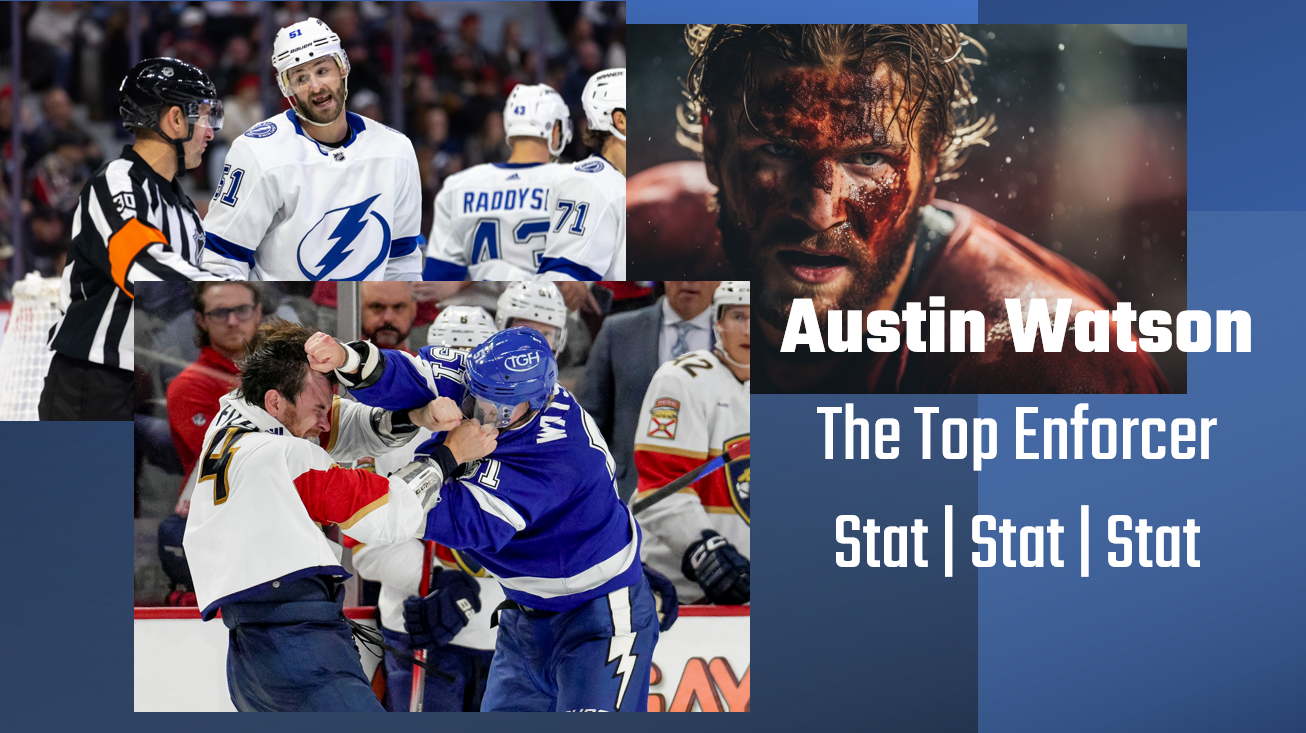
Create the Content
For us, we are fortunate to have a great designer working with us, so he took our mock-up above and turned it into the below (Austin Watson - The NHL's Top Enforcer). And while you can create decent content yourself, you can see the difference here between our design (hockey and data nerds) and the below (proper designer).
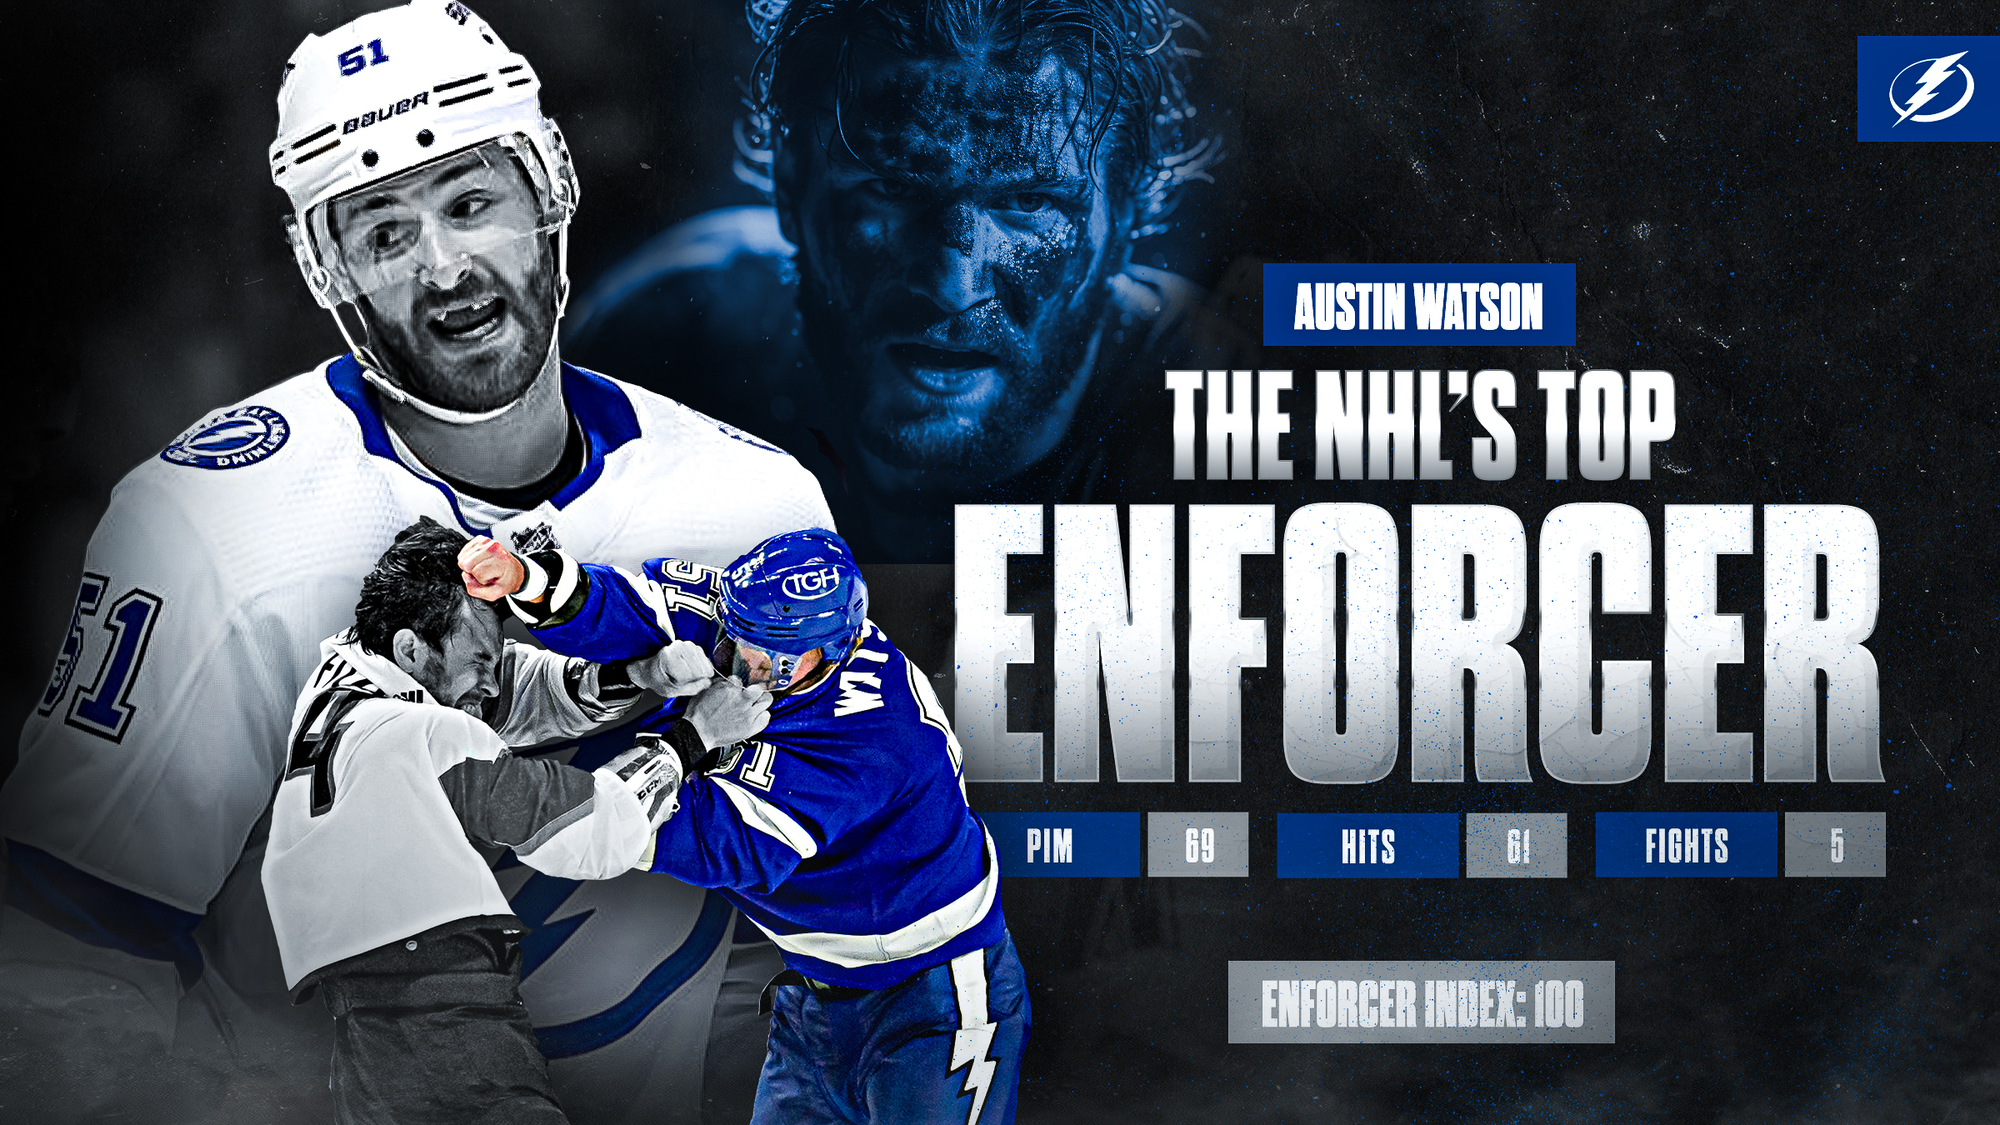
A few notes on the design here:
- The backgrounds were removed from both Austin Watson's photos to move the focus more to Austin Watson - the main character in this sample content. This removes the background noise in the photos (e.g., other players, crowd, etc.) that may distract the audience.
- The background was also removed from the tough hockey player photo and then was faded with some transparency to add to the backdrop.
- The content was divided roughly in half to create a balance across imagery and text, allowing for a natural flow from left to right.
- The stats support the main headline and of course speak to the images.
If you're looking for more data, charts or even ideas for stories, check out Enforcer Index Metrics and Charts. We've added lots of data this week that you can download and use at home, along with a few charts to inspire you!
Also, check out the below YouTube video for a quick-hit walkthrough on how to use the enforcer stats to create your own social media content!
Summary
In this week's newsletter, we introduced you to the notion of the enforcer. If you're a hockey player, then you're already familiar with the enforcer – and have maybe had a few encounters with them! We also discussed our version of an Enforcer Index, a calculated metric that measures the physical side of a player's game (but also balances it with their point production). We then used the Enforcer Index to create social media content. Because Austin Watson came out on top using our index, we featured him in our content.
We've included the data for this week in The Barn and have also created an accompanying page that includes:
- Several charts you can use for your own content efforts
- Data that accompanies each chart that can be downloaded and analyzed offline
- Downloaded PNG files for each of the charts
As a member of Data Punk Hockey, these resources are licensed for your use. We just ask that you cite us (Data Punk Hockey or datapunkhockey.com) when you use them.
Subscribe to our newsletter to get the latest and greatest content on all things hockey analytics!
Member discussion