What is a Player Performance Report?
In this Edition
- What is a Player Performance Report?
- How can we use Frequency Distributions to Understand Player Performance?
- What is Point Percentage?
- Walkthrough: Creating a Player Performance Analysis for Point Percentage
What is a Player Performance Report?
Player performance encompasses a comprehensive evaluation of an athlete's on-ice contributions. It includes common hockey statistics, behaviors, and key actions during games and practices. It also encapsulates a blend of offensive and defensive metrics, offering insights into a player's scoring prowess, playmaking abilities, defensive responsibilities, and overall impact on team success.
Player performance analyses are used in different ways, for example:
- Strategic Decisions: Teams use performance insights to formulate strategies that capitalize on players' strengths and exploit opponents' weaknesses. Whether it's line combinations, defensive pairings, or power-play units, informed decisions increase the odds of success.
- Talent Development: Player performance data highlights areas for improvement, enabling tailored training and development plans that transform potential into performance.
- Scouting and Recruitment: For scouts, performance metrics unlock insights about prospects' readiness for professional play, aiding in drafting decisions.
- Injury Prevention: By identifying performance anomalies, teams can detect early signs of physical strain, facilitating timely interventions and minimizing injury risks.
Player performance metrics cover a wide spectrum, measuring diverse aspects of a player's contributions. Below are examples of quantitative player performance metrics:
- Goals: Directly reflecting a player's scoring ability, goals quantify their ability to capitalize on offensive chances.
- Assists: Assists showcase a player's playmaking skills and contribution to setting up goals for teammates.
- Points: A player's total points (goals + assists) indicate their ability to create scoring opportunities for the team.
- Time on Ice (TOI): TOI reveals a player's importance to the team, highlighting their presence in various game situations.
- Shot Metrics: Shots, shot percentage, and shot location data unveil a player's offensive strategy, accuracy, and shooting tendencies.
- Defensive Metrics: Hits, interceptions, and blocked shots offer insights into a player's defensive capabilities and contribution to maintaining team structure.
In the dressing room, player performance analysis evolves from data to dynamic strategy:
- Individualized Feedback: Performance insights enable coaches to provide tailored feedback, fostering player growth and refinement.
- Line Optimization: Analysis helps optimize line combinations by identifying synergies between players and maximizing each unit's strengths.
- Opponent Insights: Detailed performance data helps teams decode opponents' tendencies and vulnerabilities, fine-tuning strategies for upcoming matches.
- Game Preparation: Pre-game analysis equips players with actionable information, empowering them to make informed decisions on the ice.
- Motivation and Confidence: Performance analysis highlights players' successes, bolstering their confidence and motivation.
There are various ways to measure and present insights on player performance. Let's look at how frequency distributions can be used to better understand player performance.
How can we use Frequency Distributions to Understand Player Performance?
Frequency distribution is a statistical concept that organizes data into various categories or "bins" and counts the frequency of data points that fall within each bin. It's a versatile tool that can be applied to many different sets of quantitative data to break it down into smaller, interval-based data.
To create a frequency distribution, you do the following:
- Decide on the method of creating the bins (e.g., simple sort, specific metric, etc.).
- Find the difference between the upper and lower range of the metric (e.g., maximum value and minimum value).
- Divide by the number of classes you want.
That is:
(Maximum Data Value - Minimum Data Value) / Desired Number of Classes
When applied to player performance metrics, frequency distribution provides an overview of how players' performance is distributed across different levels, allowing for a more nuanced understanding of their contributions.
Frequency distributions are useful when comparing across a sample or population of players. You can, for example, identify performance patterns (such as goals, assists, and points), uncover anomalies or outliers, conduct time series analyses on similarly grouped players, uncover trends and patterns for improvements or degradation in skill, and use player bins to compare line-up performance. Each of these enables the coaching staff to make informed decisions about individual players and teams.
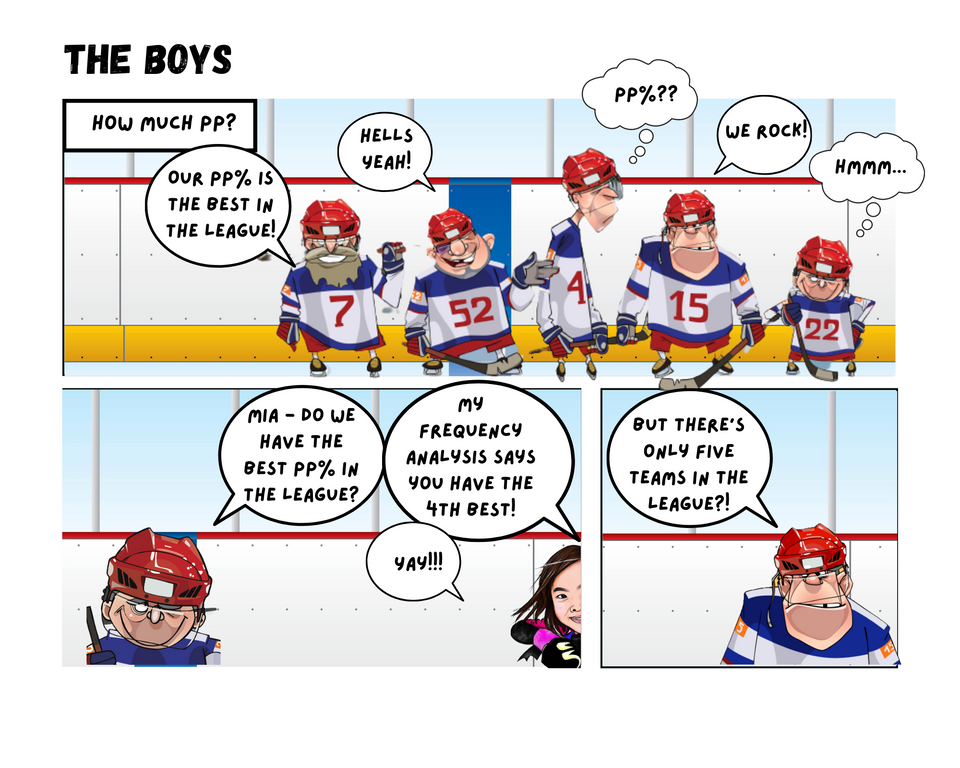
What is Point Percentage?
Point percentage is a metric that measures a player's offensive contribution to the team. For a player, it is calculated as follows:
Point Percentage = (Total Points / Total Games Played) * 100
This metric provides insight into a player's ability to consistently contribute offensively on a per-game basis. For example, let's say a hockey player has scored 15 goals and 20 assists in 50 games played:
Total Points = 15 (goals) + 20 (assists) = 35 points
Total Games Played = 50 games
Point Percentage = (35 / 50) * 100 = 70%
Thus, the player's point percentage is 70%, indicating that they've contributed to 70% of the team's total points in the games they've played.
Point percentage is a useful metric for evaluating a player's offensive impact while taking into account their participation in games. It allows for a fair comparison of players' contributions regardless of differences in the number of games played.
For the walkthrough in this edition, we want to explore the point percentage for all players in the 2022-2023 regular NHL season.
Walkthrough: Creating a Player Performance Analysis for Point Percentage
Our main hockey data provider is My Sports Feeds, so for this walkthrough our starting point is a subset of the player summary stats data from the 2022-2023 season.
The summary player stats data we'll be using in this walkthrough is as follows: Name, Position, Age, Team, Games Played, Goals, Assists, Points, Point Percentage, Shifts, and Time on Ice. To create the frequency intervals, we chose 10 and used Point Percentage as the metric to create the classes.
Creating the Frequency Classes
- Open your data in Microsoft Excel.
- Calculate the min and max values for Point Percentage, along with other measures of central tendency. You should have something similar to the below.
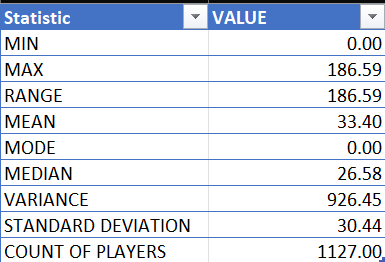
- Calculating 10 classes for your frequency distribution with the above data results in 19 for class width (which is the size of the bin).
- Map the classes to the lower and upper class limits, as is illustrated below.
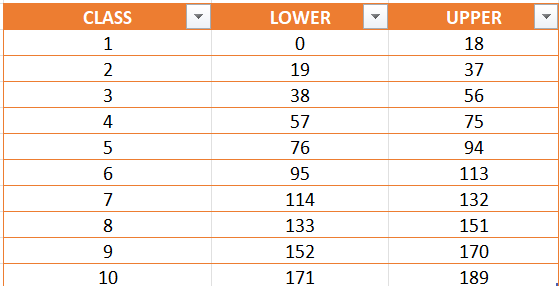
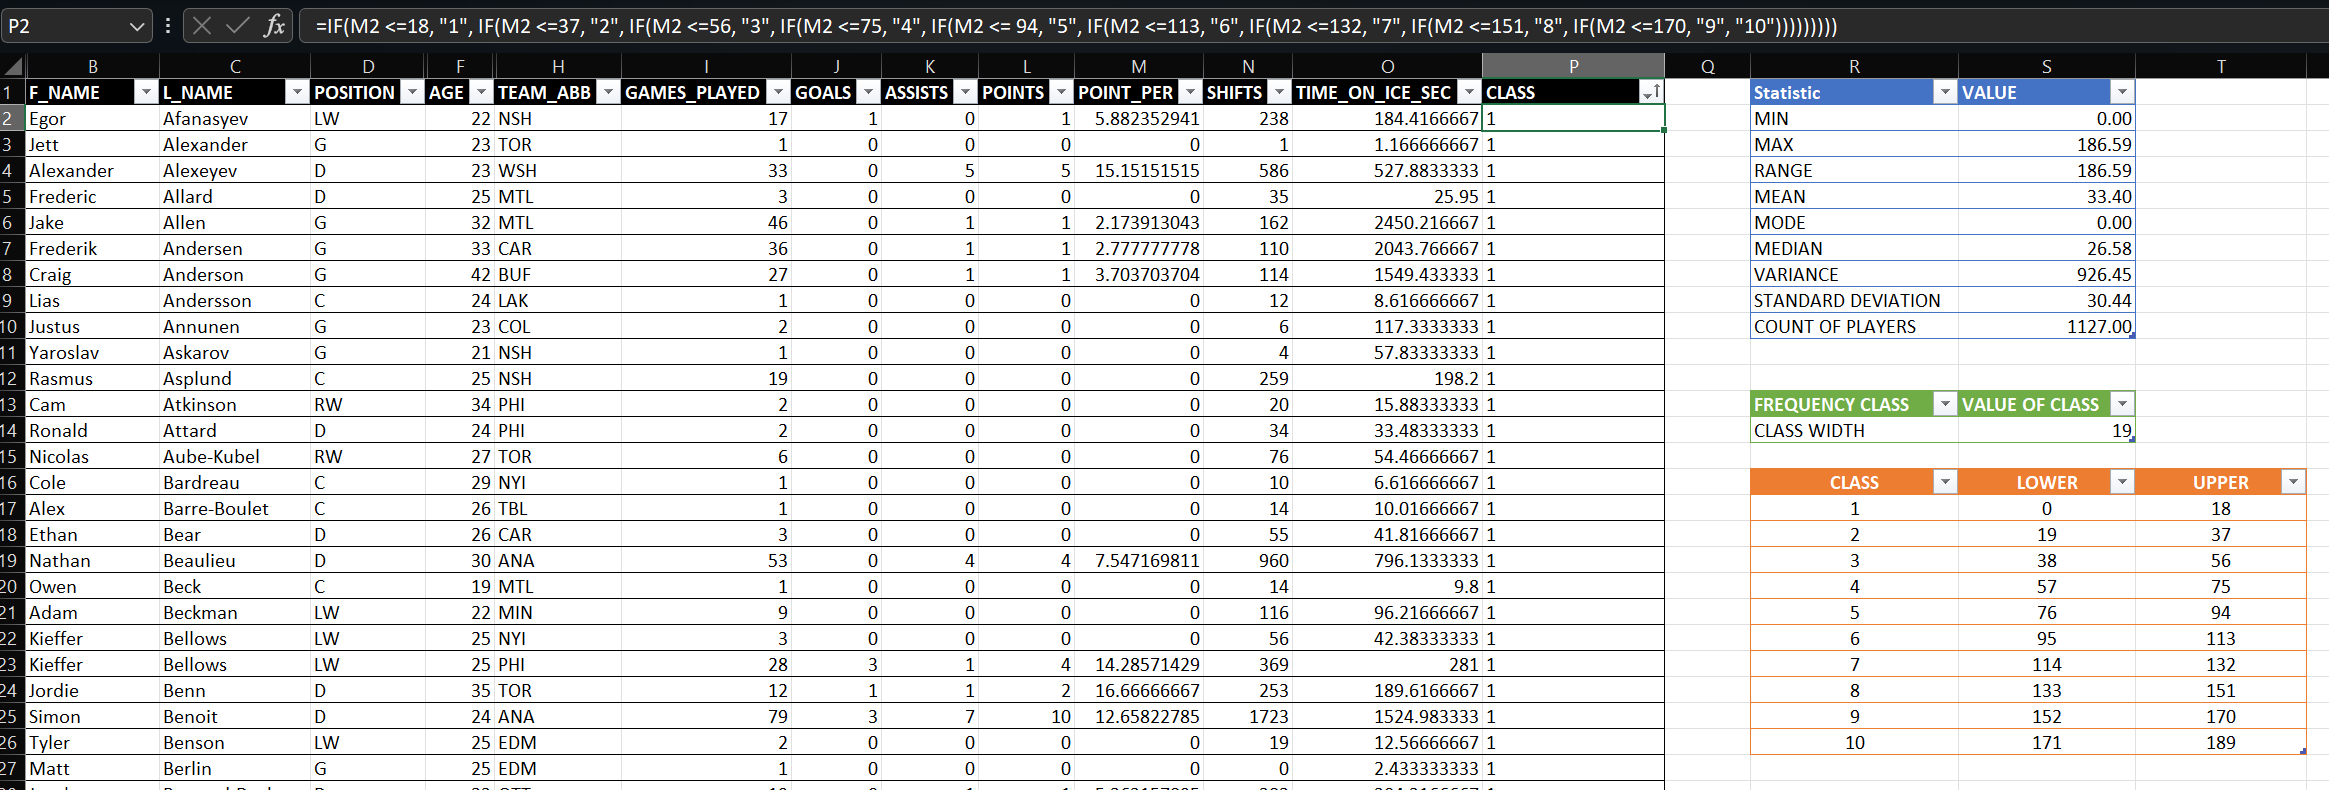
- Create a new column in your Excel spreadsheet called CLASS and leverage the following formula to assign the classes to each player.
=IF(M2 <=18, "1", IF(M2 <=37, "2", IF(M2 <=56, "3", IF(M2 <=75, "4", IF(M2 <= 94, "5", IF(M2 <=113, "6", IF(M2 <=132, "7", IF(M2 <=151, "8", IF(M2 <=170, "9", "10")))))))))
The following illustrates the result.
With the classes now created, we can now analyze them
Frequency Analysis on the Player Performance Data
You can use various methods to analyze the classes. For example, you can create a separate CSV file with the above dataset in it and then analyze it in your choice of Python, R, Power BI or other favorite tool. Given this is the L100 track, we'll stick to Microsoft Excel.
- Make sure that you've formatted the dataset as a table in Excel.
- Click at the upper left-hand column in the table and click Insert, PivotTable.
- You can now use the PivotTable to analyze different combinations of player stats for the classes. For example, one of the first analyses you'll want to run is a Frequency Distribution (including both a relative and cumulative frequency).
- To do this, drag the CLASS column into both the Rows and Values (specify Count as field value) fields. Use that table to create a table you can use later.
- You can then use this basic table (with CLASS and the Count of Players in each class) to create a Frequency table, illustrated as follows:
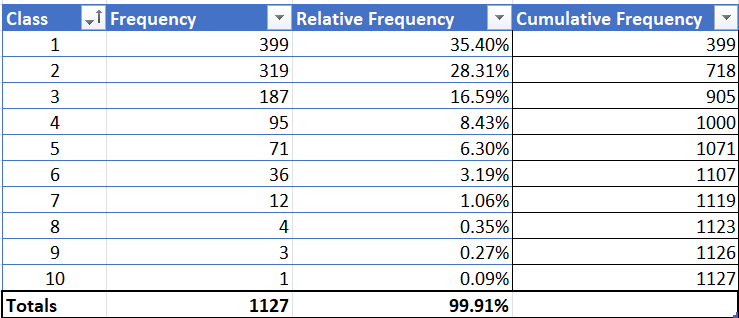
In the Frequency table, you see the Class (these are the ten classes we created using a bin of 19), the Frequency (the count of players within each class), the Relative Frequency (the percentage of players that class represents) and the Cumulative Frequency (the cumulative count of players from the smallest class to the largest one). Using just this table, you can create a couple of interesting and informative charts.
The left-hand chart shows the cumulative frequency and the right-hand chart shows the relative frequency against the count of each class.
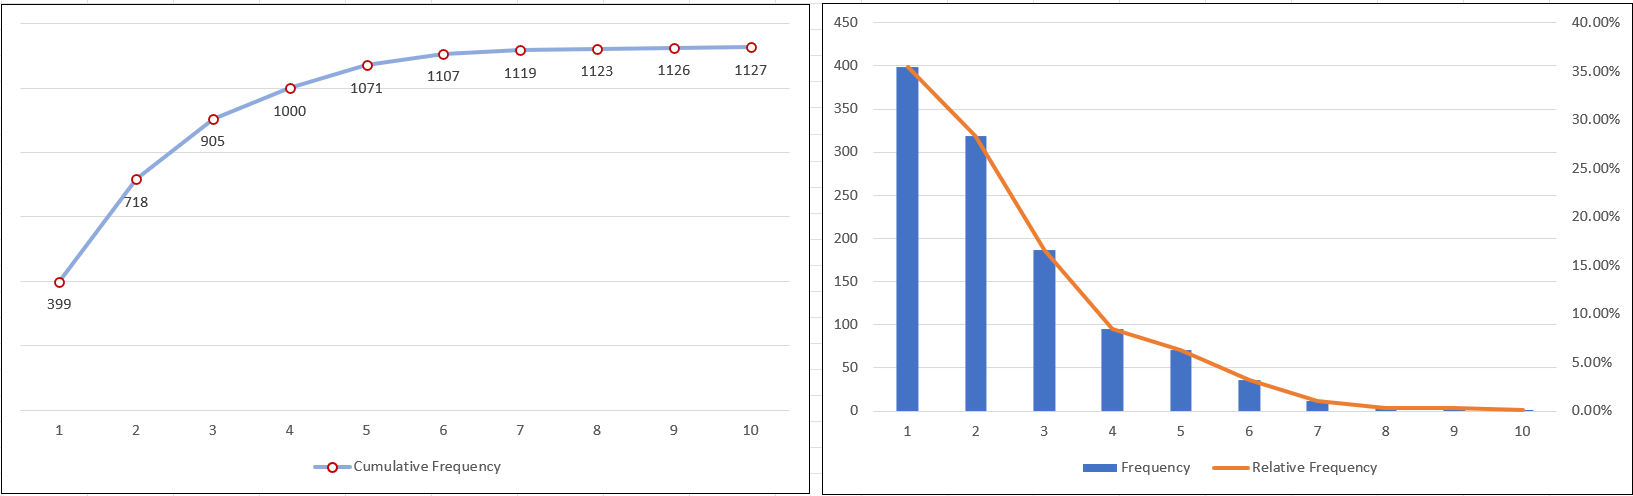
What these analyses tell us is that when the highest amount of production of players (as measured through Point Percentage) comes from a relatively small group of players. For example, if you combine classes 7-10, this equals 20 players. As part of your overall analysis, this would be the 'tip of the spear'; you'd now want to embark on your own analytical journey to explore the performance stats in each bin, conduct deeper analyses within and across bins, and so on.
To illustrate what this might look like, let's evaluate the top-most percentage of players in bins 7-10 to see if we can uncover any interesting insights.
Analyzing the Top 2% of Players
What's amazing is that bins 7-10 contain only 2% of the NHL players in the 2022-2023 regular season. In some sense, we might consider these players as the top echelon of players (again, as measured through Point Percentage). To analyze these players, we filtered the original dataset (table in Excel) to include the classes 7 through 10 and then used conditional formatting to take a second-level look at where these players were strong or challenged. The following was our result.
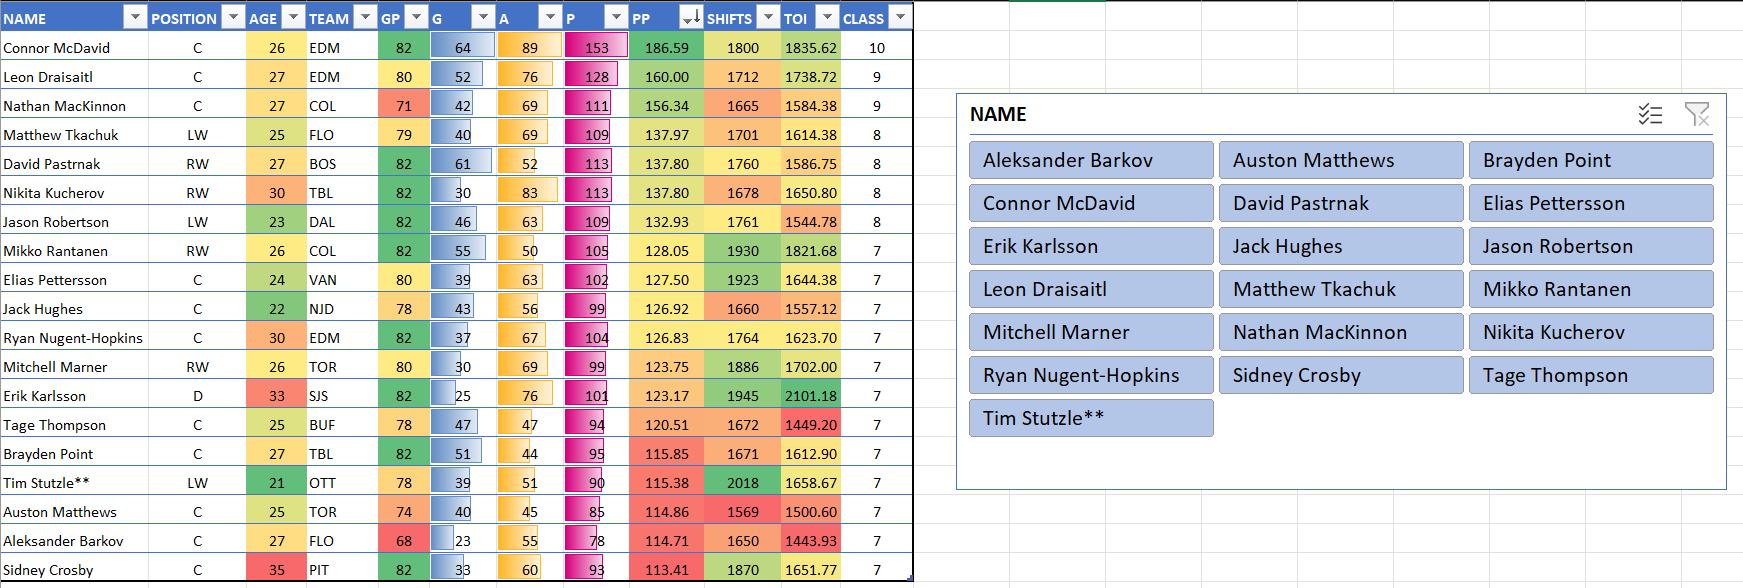
You can now see how players in this top echelon compare to one another. For example:
- Conor McDavid, Leon Draisaitl and Nathan MacKinnon are outliers when it comes to Point Percentage and all other NHL players (they are > 150).
- Sidney Crosby, Erik Karlsson, Nikita Kucherov, and Ryan Nugent-Hopkins are all still performing well at 30 years of age and older.
- You can see which players are balanced across goals and assists and where other players that may be stronger in one of these two areas. For example, if you create a new column called Ratio that calculates the ratio of assists to goals, Eric Karlsson has a 3.04 ratio of assists to goals and Nikita Kucherov has a 2.77 ratio of assists to goals; however, David Pastrnak has a ratio of 0.85 assist to goals. This gives you some sense as to the type of player they are – player maker, balanced, or goal scorer.
- Tim Stutzle performed very well at the NHL level as a rookie.
There are many other observations you can make at this level, but the point here is that once you get your data shaped into this table, you can spend time on these stats, create new ones that you're interested in (e.g., assist to goal ratio), or begin to focus in on a subset of these players (e.g., top 5 players in the league).
If you have the need, you can also create a dashboard in Microsoft Excel to help tell your story. For example, using the PivotTable, we created a few more tables and charts that we then copied and pasted into a summary dashboard. This dashboard comes with links (along the left-hand dashboard pane) to other tabs in the Excel spreadsheet for when you want to dig into the Top 2% report or create more custom reports from the data.
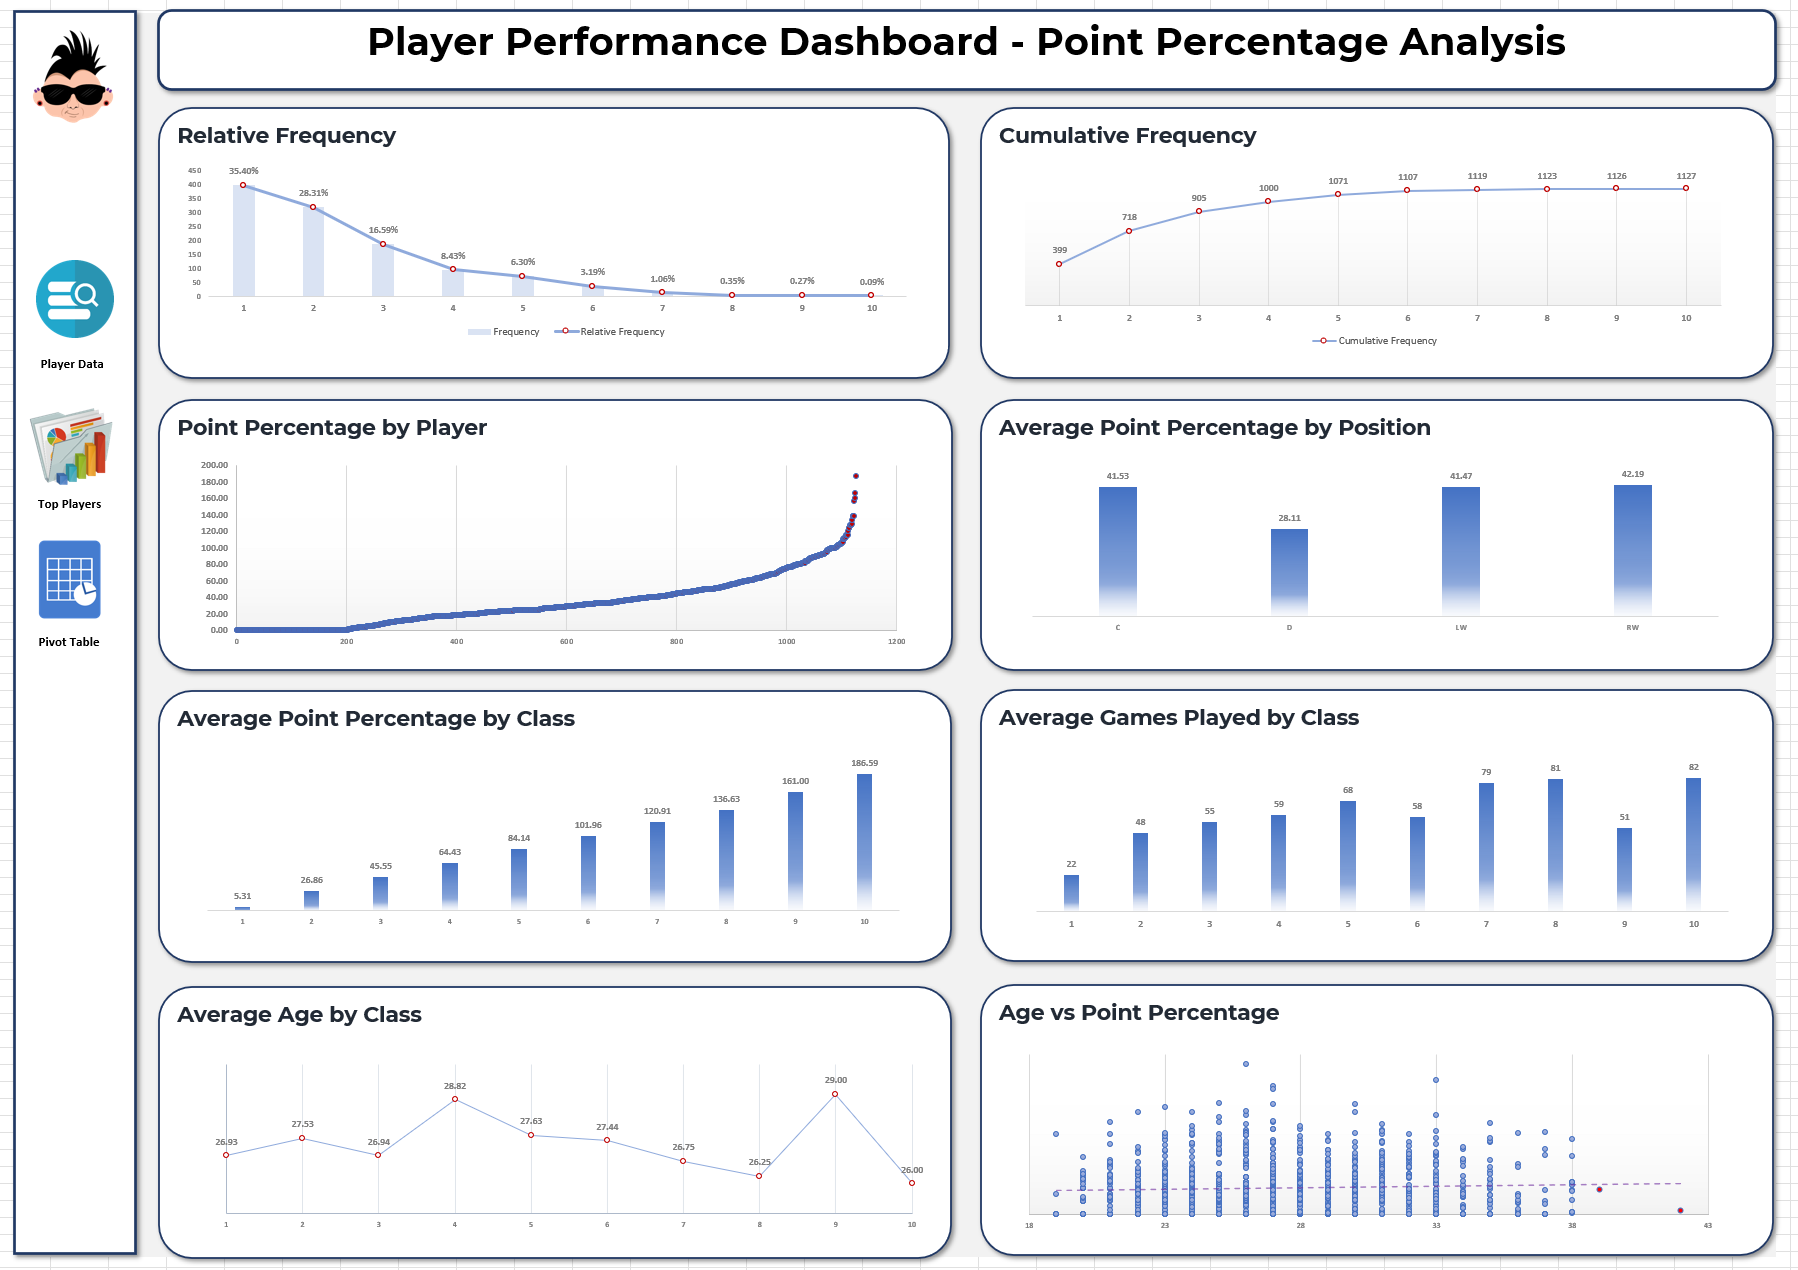
Check out the below YouTube video for a quick-hit walkthrough on how to use Microsoft Excel to build a dashboard to show off your analytic prowess!
Subscribe to our newsletter to get the latest and greatest content on all things hockey analytics!
Member discussion