Instant Hockey Analyses using ChatGPT and AI
In this Edition
- What is ChatGPT?
- How to Use ChatGPT to Analyze Hockey Data?
- Pros and Cons of using ChatGPT
- Player Performance Walkthrough
What is ChatGPT?
ChatGPT is an artificial intelligence (AI) tool that's akin to having a highly intelligent assistant who specializes in understanding and generating human-like text. It's based on a type of AI called a language model, which has been trained on a vast swath of the internet to understand context, answer questions, and provide insights in a conversational manner.
For a student in Sports Data Analysis who is new to AI and ChatGPT, here's a simple breakdown of ChatGPT.
- What ChatGPT Does: Imagine you have a vast library of sports data in your head, and with a quick question, you could access any part of that information. ChatGPT works similarly; it can sift through a large amount of information to provide answers and insights, all through text-based interaction.
- How It Helps in Analysis: For a sports data analyst, ChatGPT can be a powerful tool. You could ask it to summarize a hockey player's career statistics, explain complex statistical concepts in simple terms, or even generate reports on game analytics. It's like having a dialogue with a knowledgeable peer who can help you make sense of data quickly.
- Learning Curve: ChatGPT is designed to be user-friendly. You don't need to know any programming or have deep technical knowledge to use it. If you can ask a question clearly, ChatGPT can provide the information you need or guide you on how to get it.
- Use Cases in Sports: In the realm of hockey, ChatGPT can assist in various tasks such as predicting game outcomes based on historical data, analyzing player performance trends, and even helping draft analytical pieces on hockey strategies.
- Limitations: While ChatGPT is powerful, it's not omniscient. It can sometimes provide incorrect information and lacks the ability to think creatively or outside the box as a human analyst might. It's also reliant on the data it was trained on and might not be up to date on the most recent hockey games or statistics.
- Complementing Traditional Analysis: ChatGPT isn't a replacement for traditional data analysis tools but serves as a complement. It can handle some of the heavy lifting in data processing and initial analysis, allowing you to focus on deeper insights and strategic thinking.
In short, ChatGPT is a versatile AI companion that can help you navigate the complex world of sports data, providing assistance in data analysis, interpretation, and reporting, thereby enhancing your capabilities as a sports data analyst.
How to Use ChatGPT to Analyze Hockey Data?
The use of ChatGPT runs along a spectrum, ranging from casual, interactive use to more sophisticated, developer-oriented applications.
- Casual Interaction: At the most basic level, users can interact with ChatGPT through a simple interface, asking questions or seeking explanations on a variety of topics, including sports analytics. This requires no technical skill beyond the ability to articulate a question.
- Structured Queries: Users with a bit more familiarity with the system might use more structured queries (or prompts) to obtain specific information, such as asking for analysis of certain datasets or requesting complex information synthesis. This type of user is more likely of an intermediate level.
- Educational Use: Students and researchers can use ChatGPT to understand complex concepts, explore research topics, or get assistance with data analysis tasks. They might also use the tool to generate reports or essays.
- Data Analysis Assistance: Data analysts might use ChatGPT to process and summarize data, generate textual descriptions of data findings, or even to code simple scripts that could help with their analysis.
- Business Applications: Professionals might integrate ChatGPT into business workflows for tasks such as generating automated reports, responding to customer queries, or assisting with decision-making processes.
- Software Development: Developers can utilize the ChatGPT API to build custom applications that leverage its capabilities. This can include integrating AI into existing tools, developing new analytics platforms, or creating interactive AI features for websites or apps.
- Advanced Integrations: At a more advanced level, system architects could incorporate ChatGPT into larger ecosystems, designing systems where the AI plays a central role in data processing and user interaction.
- Product and Service Creation: Entrepreneurs might use the ChatGPT API to create new products or services, such as sports analytics platforms, fantasy sports assistants, or training tools for athletes.
- Marketplace Offerings: At the far end of the spectrum, developers and companies can create and sell their own applications or integrations through a marketplace, offering specialized tools powered by ChatGPT for specific industries or use cases, including sports analytics.
This spectrum demonstrates that ChatGPT can be as simple or as complex as the user's needs and skills permit, from basic Q&A to developing sophisticated, AI-driven applications.
Pros and Cons of using Chat GPT
The pros of using Chat GPT are as follows:
- Conversational Interface: Easy for individuals without technical expertise to use and understand.
- Time Efficiency: Rapid processing of queries that can take much longer with traditional tools.
- Versatility: Can handle a variety of data-related tasks beyond mere computation.
The cons of using ChatGPT are as follows:
- Data Complexity Limitation: May struggle with extremely complex datasets requiring advanced statistical methods.
- Depth of Analysis: The insights provided may lack the depth that can be achieved with more specialized statistical software.
- Validation: You'll still need to validate the results from ChatGPT to ensure the quality and integrity of the analysis.
Below are other common tools used by the Data Analyst in sports for a comparison – which you are also likely to use in conjunction with ChatGPT.
- Microsoft Excel: Great for spreadsheet-based analysis but lacks deep natural language processing capabilities (though Microsoft recently added "Data Analysis" as a capability where you can submit queries for analysis in Excel.)
- Microsoft Power BI: Excellent for visualizations and dashboards, but not as strong in textual data interpretation.
- Python: Highly versatile with libraries for any analytical task, but requires coding knowledge.
- RStudio: Powerful for statistical analysis and visualization, yet also demands familiarity with R programming.
Player Performance Walkthrough
This walkthrough comprises three steps:
- Source the player hockey data
- Clean the hockey data
- Analyze the player data using ChatGPT
Sourcing the Player Data
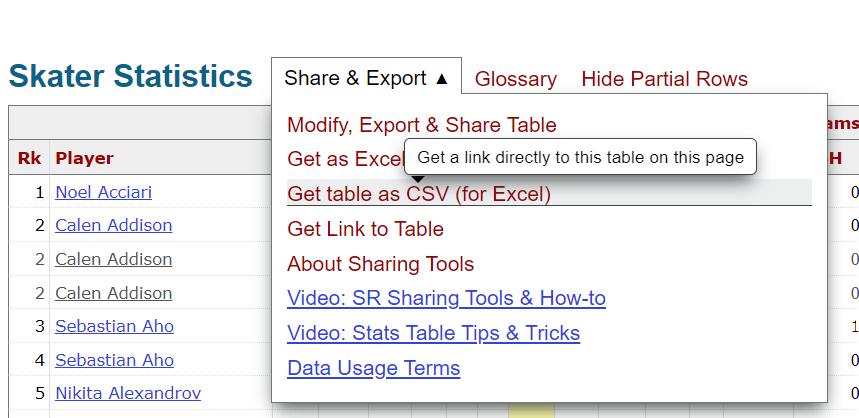
To source the data, navigate to the skater stats page on Hockey-Reference.com. Scroll down the page and click Get table as CSV (for Excel).
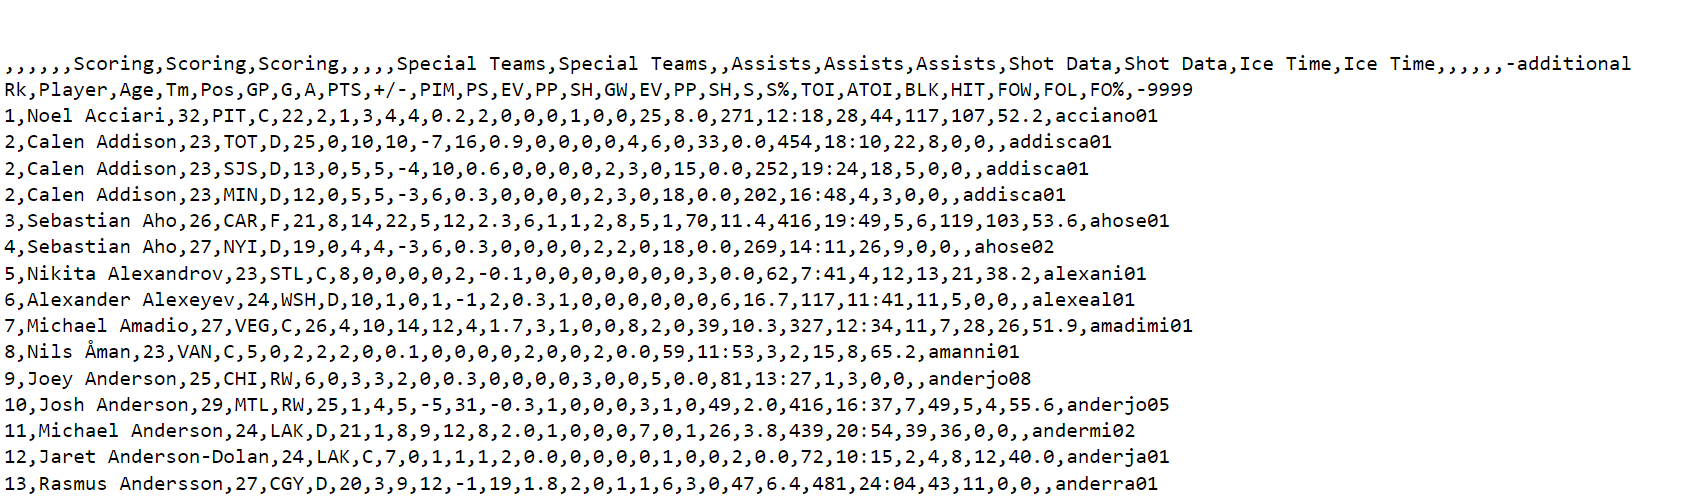
This will auto-create text-based data that you can copy and paste into a Notepad or other text file – see below for an excerpt of what the data looks like. Save the text file as a CSV file, for example reference_hockey_player_stats.csv.
To test the usability if the data file, open it in Microsoft Excel. (You'll want to remove the header row that categorizes the columns.)
Cleaning the Hockey Data
For this walkthrough, we won't transform any of the columns into specific data types – we'll let ChatGPT handle the data natively and transform if need be. However, we do want to make the column headers readable. So, you can either manually adjust the column headers or write a quick program in R to clean up the column headers.
We created a simple R application in RStudio, which can be seen below. This code reads in the CSV file that you downloaded from the Hockey-Reference web site, renames the column headings and then creates a new data frame for you. Lastly, the application writes a new file to disk. This new file (new_player_stats_data.csv) will be the one you use with Chat GPT.
library(dplyr)

player_data_df <- read.csv("reference_hockey_player_stats.csv")

colnames(player_data_df) <- c("RANK", "NAME", "AGE", "TEAM", "POS",
                              "GP", "G", "A", "PTS", "PLUS_MIN", "PIM",
                              "PT_SHARE", "ESG", "PPG", "SHG", "GWG",
                              "ESA", "PPA", "SHA", "SHOTS", "SHOT_PCT",
                              "TOI", "AVG_TOI", "BLKS", "HITS", "FOW",
                              "FOL", "FO_PCT", "MISC")

sub_player_data_df <- player_data_df %>%
  select(-MISC, -RANK) %>%
  arrange(desc(PTS))

print(head(sub_player_data_df))

write.csv(sub_player_data_df, "new_player_stats_data.csv", row.names = FALSE)
Let's move onto the final step: analyzing the data in ChatGPT.
Analyzing the Hockey Data in ChatGPT
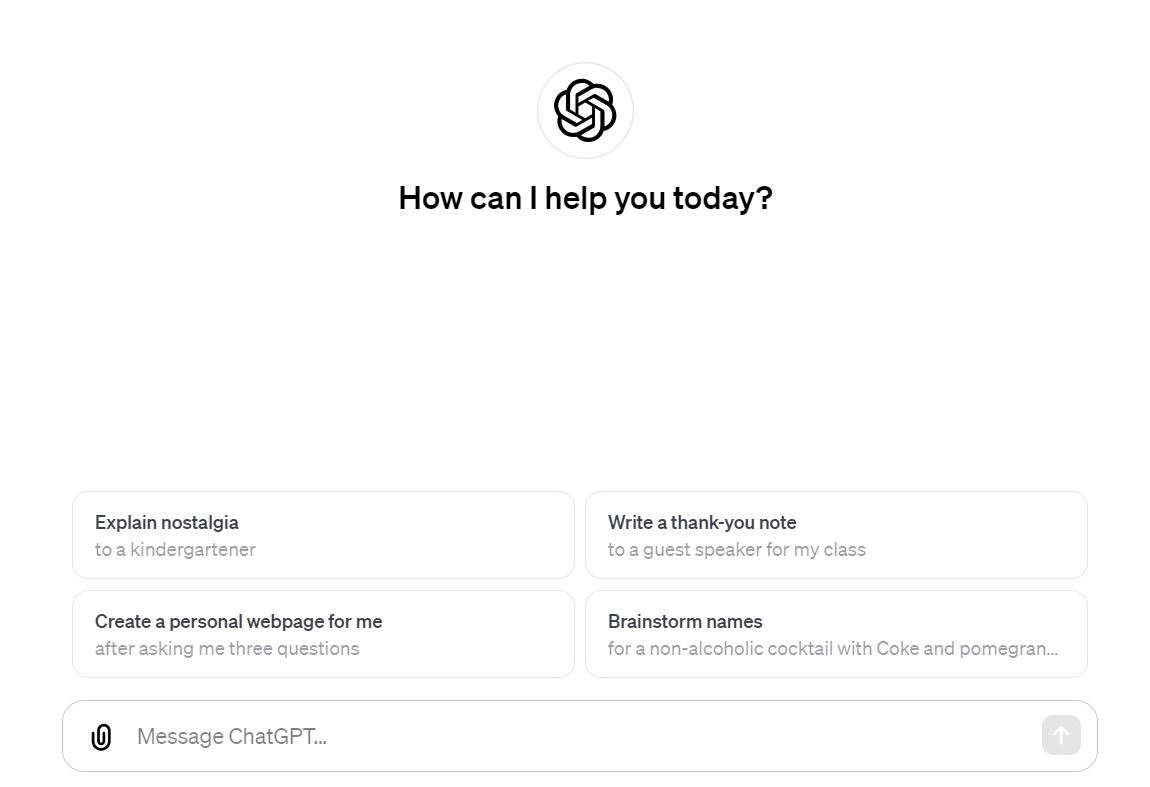
To begin this step, navigate to the ChatGPT site. (If you haven't already, sign up for the ChatGPT service.)
- In the upper left-hand portion of the page, click New Chat.
The below is what you'll see: a message, example prompts (a prompt is the text that you write in the Message ChatGPT field) and the prompt field with a paper clip.
- Click the paper clip, navigate to the new_player_stats_data.csv file and click Open. The file will be uploaded into the ChatGPT session, per below.
- At this point, you type in a prompt, which ChatGPT translates into action. For example, let's create a player performance report that compares the centermen from the Carolina Hurricanes to the centermen from the Buffalo Sabres. You want to give some context with the prompt, so try something like the following:
You are a hockey analytics expert with a background in data science and work as a Data Analyst for the Carolina Hurricanes. Carolina's next game is at home against the Buffalo Sabres. The Analytics Manager of your team has asked you to prepare a player performance report that compares the centermen that play for Carolina with the centermen that play for Buffalo Sabres.
ChatGPT's initial response was to describe the data in the dataset you provided; it gave a short description for each column in the file. It then filtered the dataset for centermen from Carolina and Buffalo and compared statistics like Points, Goals, Assists, Faceoff Win Percentage, and others, shown below.
Carolina Hurricanes Centermen
- Seth Jarvis - Age: 21, GP: 24, G: 9, A: 10, PTS: 19, +/-: +2, PIM: 4, Shots: 50, Shot %: 18.0, FO %: 47.7
- Martin Nečas - Age: 25, GP: 24, G: 7, A: 11, PTS: 18, +/-: -7, PIM: 10, Shots: 58, Shot %: 12.1, FO %: 36.0
- Jesperi Kotkaniemi - Age: 23, GP: 24, G: 8, A: 7, PTS: 15, +/-: -3, PIM: 14, Shots: 54, Shot %: 14.8, FO %: 46.3
- Jordan Staal - Age: 35, GP: 24, G: 2, A: 6, PTS: 8, +/-: -7, PIM: 18, Shots: 40, Shot %: 5.0, FO %: 57.9
- Jack Drury - Age: 23, GP: 24, G: 3, A: 3, PTS: 6, +/-: +3, PIM: 12, Shots: 29, Shot %: 10.3, FO %: 54.5
- Callahan Burke - Age: 26, GP: 1, G: 0, A: 0, PTS: 0, +/-: 0, PIM: 0, Shots: 0
Buffalo Sabres Centermen
- Casey Mittelstadt - Age: 25, GP: 25, G: 5, A: 16, PTS: 21, +/-: +1, PIM: 12, Shots: 35, Shot %: 14.3, FO %: 45.9
- Tage Thompson - Age: 26, GP: 16, G: 6, A: 6, PTS: 12, +/-: -5, PIM: 6, Shots: 52, Shot %: 11.5, FO %: 42.6
- Dylan Cozens - Age: 22, GP: 23, G: 4, A: 7, PTS: 11, +/-: -5, PIM: 25, Shots: 56, Shot %: 7.1, FO %: 48.1
- Tyson Jost - Age: 25, GP: 20, G: 2, A: 2, PTS: 4, +/-: -5, PIM: 4, Shots: 23, Shot %: 8.7, FO %: 33.8
- Peyton Krebs - Age: 23, GP: 23, G: 1, A: 3, PTS: 4, +/-: +3, PIM: 14, Shots: 16, Shot %: 6.3, FO %: 44.2
- Zemgus Girgensons - Age: 30, GP: 20, G: 2, A: 0, PTS: 2, +/-: -3, PIM: 7, Shots: 27, Shot %: 7.4, FO %: 59.1
- Jiri Kulich - Age: 19, GP: 1, G: 0, A: 0, PTS: 0, +/-: -1, PIM: 0, Shots: 1, Shot %: 0.0
- Matthew Savoie - Age: 20, GP: 1, G: 0, A: 0, PTS: 0, +/-: 0, PIM: 0, Shots: 0
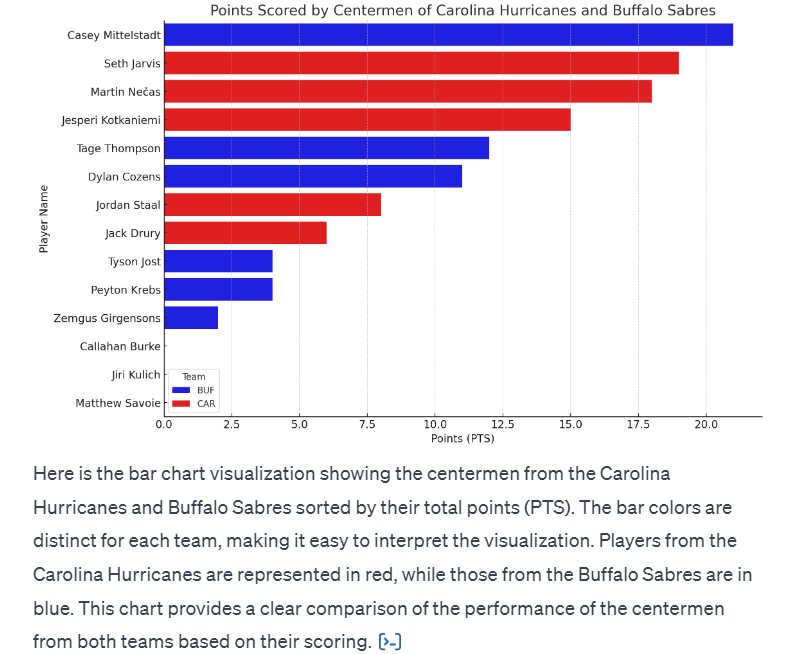
While this is informative, you likely want to have an easier, more intuitive visualization. So, you can continue to give ChatGPT prompts that get more specific or take a different approach. For example, the below prompt asks ChatGPT to create a bar chart with a sorted view by points.
Can you create a bar chart visualization that presents a sorted view of the centermen from highest to lowest using PTS. Make sure that the bar colors are different for each team so it's easy to interpret the visualization.
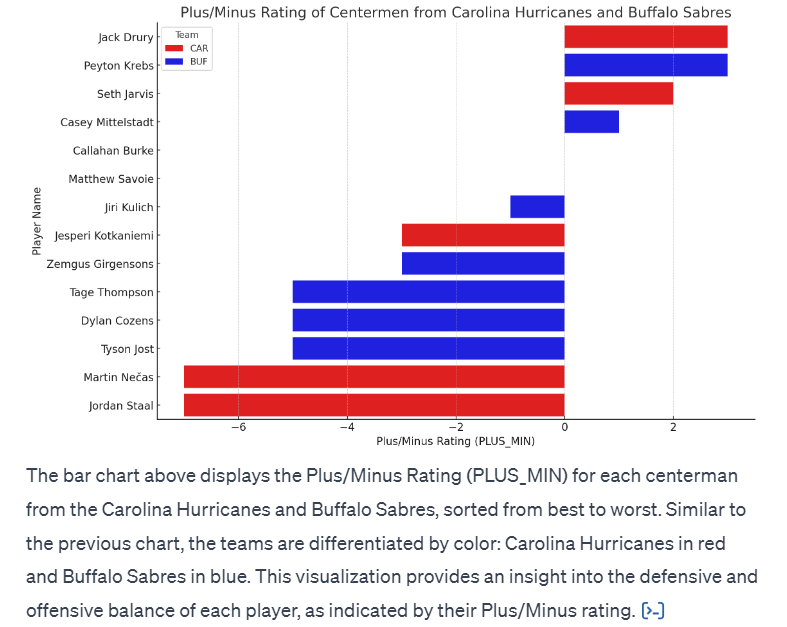
We'll submit another prompt, this time requesting a ranked visualization for plus/minus scores.
Can you plot the PLUS_MIN for each centerman, again sorting the chart from best to worst and giving the two teams different colors in the chart.
Lastly, here's another prompt that we used to compare the top centerman from Carolina with the top centerman from Buffalo.
How would you compare the top centerman for Carolina with the top centermen for Buffalo? And can you create a visualization to help show how they compare?
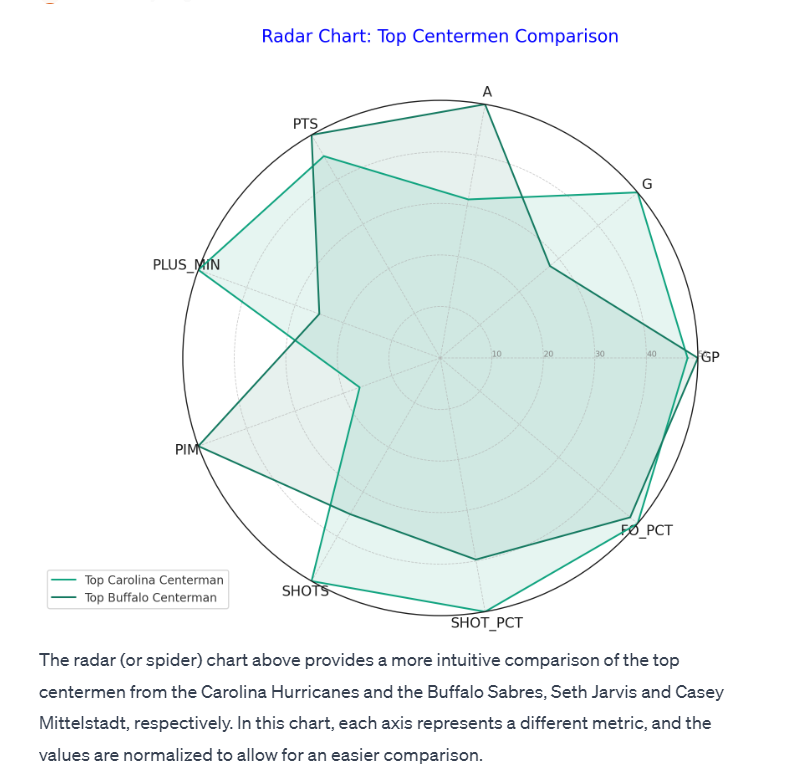
The above was better (save for the low contrast colors in the spider chart), so as you explore ChatGPT try different prompts. After you're done, prompt ChatGPT to provide a downloadable CSV, so you can continue to use the results of the ChatGPT session offline in, for example, Microsoft Excel or Power BI.
Can you provide a downloadable CSV file that has all of the stats for the Carolina and Buffalo centermen?
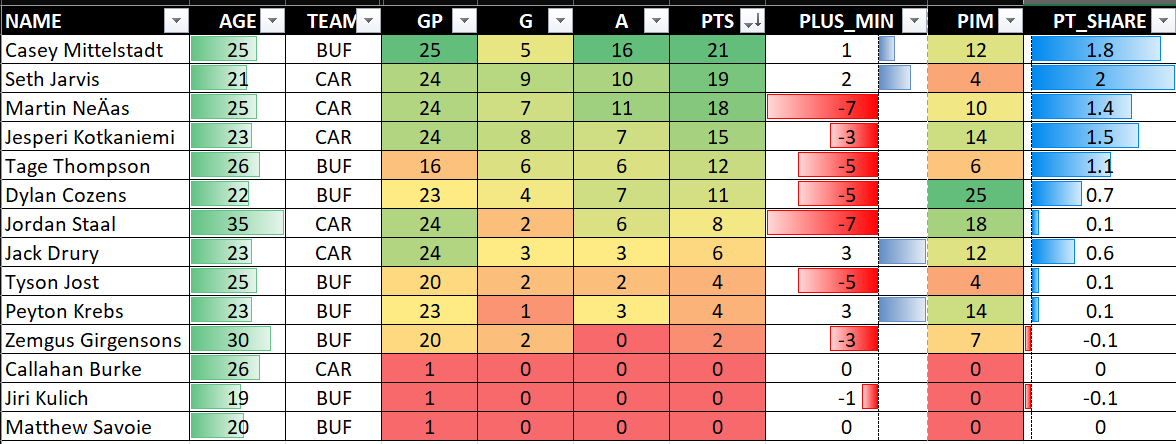
After you have the CSV downloaded locally, you can then open or import it into your tool of choice and continue your analysis. For example, below is a table in Excel with some conditional formatting - a quick and great way to create heat map or data bars for comparative visualization. The below heatmap is sorted on PTS to show comparative strengths of players across the different statistics.
Check out our quick-hit video tutorial on YouTube:
Summary
In this edition, you learned about generative language models, were introduced to ChatGPT and its potential in Hockey Analytics and we walked you through a practical example comparing centermen from Carolina and Buffalo.
GPT is the next generation of AI and can be used across a broad audience. For example, hobbyists can quickly download data from sports web sites and use ChatGPT to run quick analyses. Further along the spectrum, data analysts, data scientists and sports scientists can use ChatGPT as a productivity tool to explore data, test correlations and identify patterns and trends without the need to do a lot of coding.
AI will only expand in its use and practicality within sports analytics, so we would recommend spending time learning and using this technology. Across the spectrum of use, you will surely find many different ways to benefit from AI.
Subscribe to our newsletter to get the latest and greatest content on all things hockey analytics!
Member discussion