Who are the Top Ten Playmakers in the NHL?

In this Edition
- Breaking Down the Question
- Defining and Measuring Playmaker
- Required Data for the Playmaker Analysis
- Conducting the Playmaker Analysis
Breaking Down the Question
No matter the industry, a good, concise question gives structure and direction to your analysis. Sometimes, the question is clear so breaking it down is straightforward; however, often times the question is unclear. This requires follow-up discussion or analyzing the data from multiple perspectives.
For this analysis, let's start by breaking down Who are the top ten playmakers in the NHL?
From the question, the following is clear:
- Who are the player's names who are the playmakers
- The top ten is a sorted list of the top ten playmakers
- NHL is the source of the players
But, we have questions.
- What is the timeframe for the analysis – a specific season, across all time, specific dates?
- Do we need to look at specific positions or is this across all positions?
- How do we define a playmaker?
This is where you need to either clarify with your stakeholder(s) or draw your own assumptions. For this analysis, we'll assume the following:
- For the specific timeframe, we will assume the 2022-2023 NHL Regular Season.
- We will include all positions in the analysis.
- We will create a metric to define playmaker.
Let's first look at how we define the playmaker metric and then do the analysis.
Defining & Measuring Playmaker
Several hockey statistics could act as a measure for a player being a playmaker. For example, you could take a simple approach with basic (observable) stats and look at a player's goals or assists. You could extend the basic and factor in calculated statistics like Corsi, Fenwick, PDO or Zone Starts to add more dimensionality to a player's playmaking ability. And further, you could evaluate the situation within which the plays occur – e.g., power play, penalty kill, and even strength situations. You could also take a progressive approach and start with simple statistic (say assists) and then factor in other measures to get to a more complete analysis.
For this analysis, we'll keep it simple and use an assists to goal ratio. This is because assists represent a core and simple metric for a player's playmaking ability, but the playmaking prowess should include some amount of goal scoring. We will call this new metric AG Ratio.
The AG Ratio, short for "Assist to Goal Ratio," aims to quantify a player's playmaking ability. Calculated by dividing the number of assists by the number of goals scored, the AG Ratio provides a simplified representation of how a player contributes to their team's offensive success. A higher AG Ratio indicates a player who excels in setting up goals, making them a valuable playmaker on the ice.
The premise of including both assists and goals in the AG Ratio is threefold:
- Balanced Perspective: By considering both assists and goals, the AG Ratio offers a more balanced view of a player's offensive contributions. It recognizes that not every player can be – or should be – a pure goal-scorer, highlighting the significance of facilitating scoring opportunities.
- Playmaking Emphasis: Hockey is a team sport, and playmaking is central. By putting assists on equal (if not higher) footing with goals, the AG Ratio acknowledges the importance of unselfish play and the ability to create scoring chances for teammates.
- Versatility: A player with a high AG Ratio can be a versatile asset to their team. They can adapt their style to either score goals or set up their linemates, depending on the situation, making them a dynamic offensive presence.
The AG Ratio can also be used by coaches, analysts and sports scientists in different ways. For example:
- Playmaker Identification: The AG Ratio can help identify the primary playmakers on a team. Analysts can pinpoint players who consistently set up goals for their teammates, even if they don't score as many themselves.
- Line Chemistry Assessment: Analyzing the AG Ratio of a line or a pair of teammates can reveal the synergy between players. A high AG Ratio for a line suggests excellent chemistry and teamwork.
- Tactical Adjustments: Coaches and analysts can use the AG Ratio to make tactical adjustments. If a team lacks playmakers, they may need to focus on recruiting or developing players with higher AG Ratios to improve their offensive strategy.
- Player Development: Teams can use the AG Ratio to assess player development and track improvements in playmaking skills over time. It provides a tangible measure of a player's ability to create scoring opportunities for others.
So, what data do you need to do the analysis?
Required Data for the Playmaker Analysis
You'll need a several player data points to complete your analysis from the 2022-2023 Regular NHL season.
- Name
- Team
- Position
- Goals
- Assists
You might also want to include some other factors for follow-on analysis, such as:
- Games Played
- Points
- Age
- Shifts
- Time on Ice
- Rookie (Yes/No)
While not central to your analysis, you may find something useful by including them in your analysis. Widening the aperture of data can help uncover trends, patterns and challenge initial assumptions.
Conducting the Playmaker Analysis
The first step is to source your hockey data. If you work for a professional sports club or organization, then you'll have access to various data sources. If you're a hobbyist or a student, you can get the player data from various online sources, such as https://www.hockey-reference.com/leagues/NHL_2023_skaters.html.
To download the data:
- Navigate to the Hockey-Reference web site.
- Click Share and Export and then select Get Table as CSV (for Excel).
- Copy and paste the data into Notepad (or other text file application) and save the file as a CSV file.
- Open the CSV file in Excel.
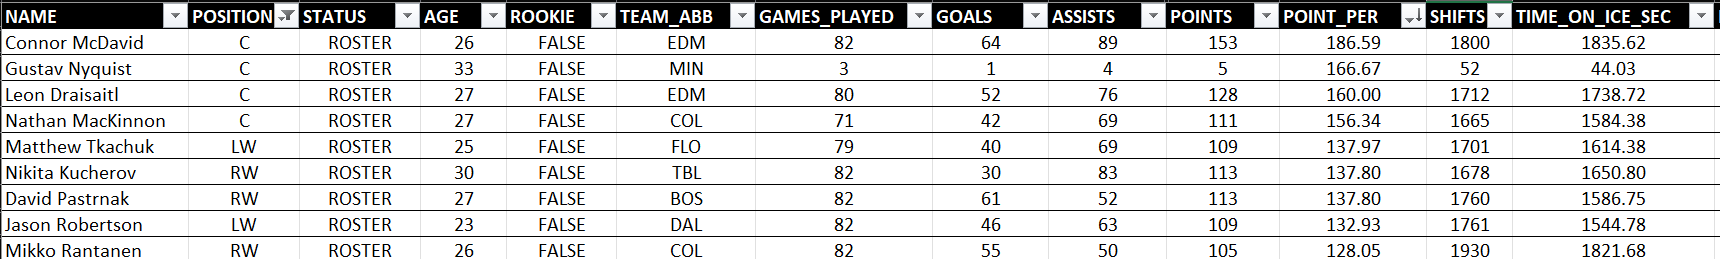
After you download the player data, format it in Microsoft Excel so the columns are more readable, the data is more structured, filterable, etc. You should have at this point something that resembles the following spreadsheet.
The next step is to calculate the AG Ratio (or AG_RATIO), using the ASSISTS and GOALS columns (ASSISTS / GOALS). To create the AG_RATIO column:
- Insert a new column.
- Use the following formula to guide how you calculate the AG Ratio:
=IF([@GOALS]=0, 0, [@ASSISTS]/[@GOALS])
After you create the AG_RATIO metric, sort from largest to smallest, the dataset will now look similar to the following:
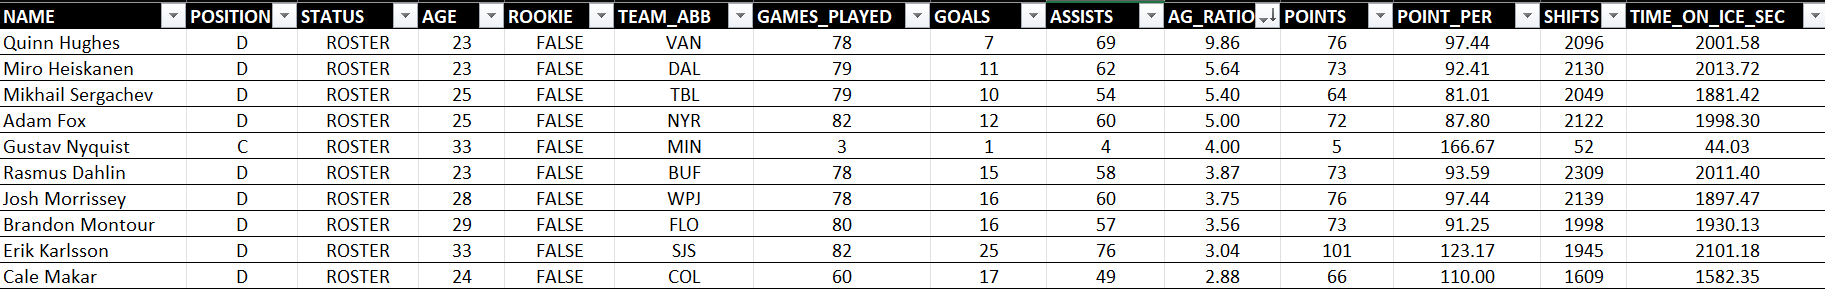
You could conduct the analysis at this point; however, we see two issues.
- The first is that the one forward in the results only played 3 games. To manage this, you can create a rule to remove outliers like this (e.g., a minimum amount of GAMES_PLAYED). The threshold is subjective, but using a threshold of, say, 20 GAMES_PLAYED would be better than 3. You can decide on a rule that best fits your scenario (and the stage of the season).
- The second is that most of the top ten positions are defensemen (D). While the requestor didn't specify positions, you should explore the POSITION dimension more on this dataset.
Joshua Pollock, in his book entitled Everything You'll Ever Need to Know About Hockey Analytics, addresses why you'll find this second issue: "defensemen are almost never in a position to score, but can get Assists on breakouts, and through usage in the opponent's zone. This leads to d-men being low on the average NHL Points ranking, but high in Assists" (p15). Based on this, we may want to restrict our definition of playmaker to comprise only forwards.
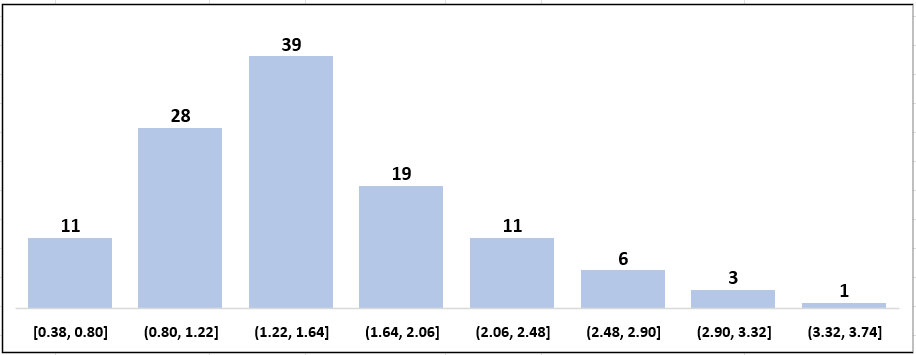
The next step is to conduct an exploratory data analysis (EDA). This is a common first step in analytics projects to explore the data, uncover patterns and trends, etc. For example, you explore the distribution of AG Ratio in the EDA, as seen below. This shows that most players (n = 39) sit between an AG Ratio of 1.22 and 1.64.
Based on our second issue above, we can also explore how the defensemen differ from the forwards. To do this, we created a new PivotTable using the player data table and pivoted POSITION against AG_RATIO (using Average instead of SUM for AG_RATIO). When charted, your results will likely resemble the below.
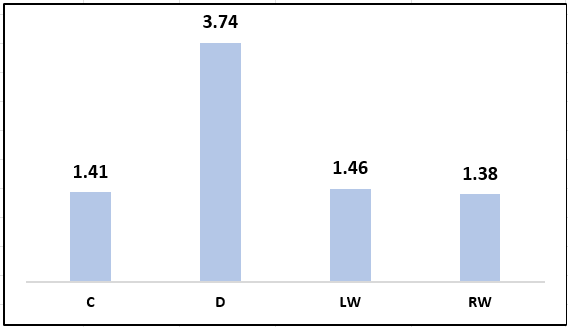
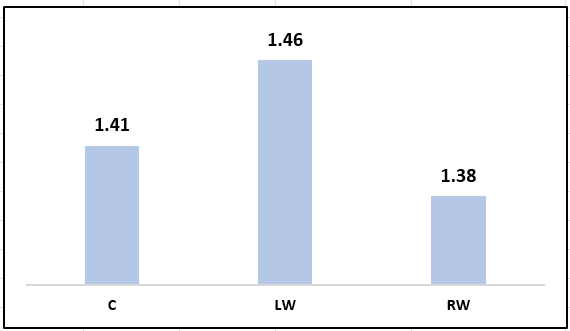
At this point, we filtered out the defensemen to include only forwards. This makes the AG Ratio closer across the three groups of forwards.
To take the next step, create classes (or categories) using the AG Ratio. For example, you can use Finisher, Balanced and Playmaker as three categories. The Finisher class is highest in goal-scoring. The Balanced class is roughly balanced between the total number of goals and assists they obtain. And Playmaker is the highest ratio of assists to goals.
To do this, you can create thresholds for your classes using the distribution. We defined the Playmaker as having an AG Ratio >= 2.44, the Balanced between 1.41 and 2.43 and the Finisher as < 1.41. (Again, you should use rules here that make more sense to your specific scenario.) In Microsoft Excel, you can use the following formula to asses the AG Ratio (which in this case is in L2) and add the appropriate classification in a new column called AG_CLASS:
=IF(L2 >= 2.44, "Playmaker", IF(L2 >= 1.41, "Balanced", "Finisher"))
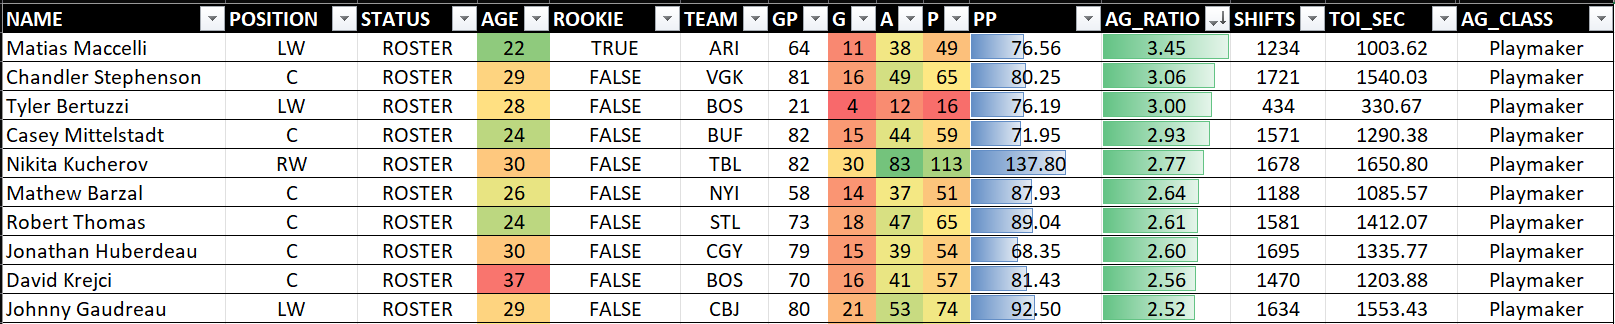
You can now filter on the Playmaker column and filter the top ten using AG_RATIO, you should see something similar to the below. Note that we applied some conditional formatting to better visualize and compare the data. For example, we added conditional formatting to the AG_RATIO and PP columns to help visualize ranking. We also added conditional formatting to the AGE, G, A, and P columns to create a comparative heatmap across the players.
To see a quick-hit video walkthrough on this analysis, check out the below:
A few call-outs from the above analysis are as follows:
- The top playmaker from our analysis was a rookie.
- A high-production player is Nikita Kucherov, who had a high AG_RATIO and a high PP (Points Percentage).
- Five of the players in the top ten were younger than 28 (average age), so could have good runway in their career.
- Boston had two playmakers in the top ten.
There are certainly more call-outs from the above analysis and follow-on analyses you may want to conduct, but this analysis gives you a simple path to answer the original question.
Summary
This article showed you how to break down a stakeholder question and then analyze that question using a combination of existing hockey data and a custom metric that represents hockey playmakers. We built assumptions into the definition of the metric, showed you design flaws of that metric and then used the collected data to complete the analysis.
This article also illustrated that you can be creative in creating metrics for different analyses. The custom metric was called AG Ratio (assists to goals) as a basic metric to represent playmakers. However, there are other ways to potentially define such a metric. For example, according to Alvin Almazov, "a playmaker is a type of hockey player that has exceptional speed and skill that is able to create chances for their team and usually scores more assists than goals." We also referenced Joshua Pollock, who in his Hockey Analytics book offers that the playmaker could be defined as someone who scores at least "10 more Assists than Goals." So, there's no standardized approach here giving you some latitude for statistical creativity.
We then created a three-tiered classification system using the AG Ratio metric to get to the top ten playmakers. This allowed for further filtering and analysis on total numbers of the different categories of each type of player (more specifically, the total number of playmakers beyond the ten in question here).
Finally, you used some of the native conditional formatting capabilities in Excel to create comparative highlights through a heatmap that gave you (and your stakeholder) more insights into the analysis.
Subscribe to our newsletter to get the latest and greatest content on all things hockey analytics!