From Rink to Rank: Translating Hockey Gameplay into Numbers

In this Edition
- What's an Offensive Zone Play Example and the Stats Associated with It?
- What are Examples of Defensive Dynamics?
- What about the Last Line of Defense: Goaltending?
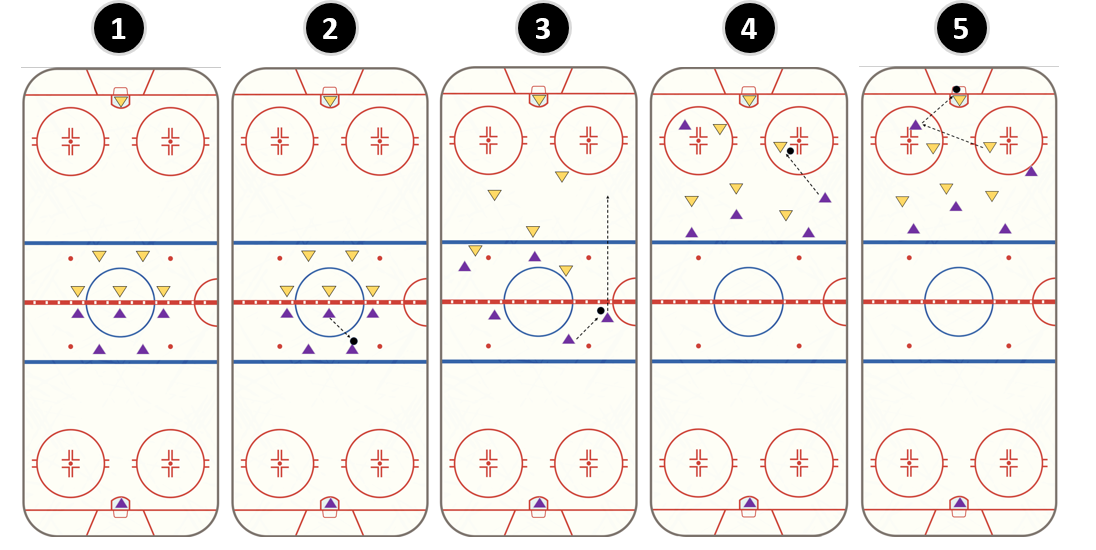
What's an Offensive Zone Play and the Stats Associated with It?
Imagine the game is underway, and Team A's center wins the face-off. He moves the puck to the defenseman who passes to the right winger. The right winger then crosses the blue line into the offensive zone and shoots on net, but the shot is blocked by one of the defensemen from Team B. Finally, the blocked shot ricochets to Team A's left winger, who quickly snaps a shot into the net. This play results in a goal for Team A. In the image below, we've summarized the play with five successive steps:
- Teams line up for the face off at center ice.
- Team A's center wins the face off and in that process moves the puck to their right defenseman.
- The right defenseman quickly moves the puck to the right winger, who then bursts into the offensive zone. Team A starts in on the offensive attack. Team B moves into defensive positions, trying to cover open players.
- Team A's right winger sees an opening and takes a shot from the top of the circle; however, the defenseman gets in-between the winger and the goalie and blocks the shot.
- In an odd bounce, the puck deflects to Team A's left winger who snaps the puck with a one-timer into the net. Team B's goalie was partially screened by his defenseman, so the deflection and one-time snap shot from Team A's winger is too quick.
In this play, several statistics would be recorded. For example:
- The center from Team A would be credited with a face-off win, which contributes to his face-off win percentage.
- Both the defenseman and the right winger would each earn a 'plus' in the plus/minus category for being on the ice when their team had control of the puck in the offensive zone.
- The defenseman's shot, despite being blocked, would count as a shot attempt, contributing to the right winger's individual Corsi statistic, a measure of the total shots directed at the net during even-strength play.
- The defender from Team B, on the other hand, would get credit for a blocked shot.
- Team A's left winger would be credited with a goal, a shot on goal, and a plus in the plus/minus category for that shift.
- The defenseman and the right winger, if they were the last two players to touch the puck, would be credited with assists.
- Finally, the goalie would be "credited" with a goal against, which would impact his goals against average (GAA).
- All players from Team A on the ice would see increases in their plus/minus ratings, as a goal was scored during their shift. All players from Team B on the ice would see decreases in their plus/minus ratings, as a goal was scored against them during their shift.
While the above can happen in hockey, scoring goals in a few seconds is rare. But let's, for argument sake, say that all of the above happened within five seconds of the puck being dropped. You begin to see just how many stats can be collected in a very short period of time during a hockey game.
What are Examples of Defensive Dynamics?
Let's switch gears and focus on Team B. The moment the puck enters their defensive zone, their primary objective becomes to prevent a scoring opportunity for Team A. This involves blocking shots, disrupting passing lanes, and ultimately, getting the puck out of their zone.
For instance, suppose a defenseman from Team B manages to steal the puck from an opponent (this would count as a takeaway in the stat sheet), then he passes to a forward who successfully clears the puck out of the defensive zone and into the neutral zone. This clearing attempt, if successful, doesn't directly translate into a standard statistic, but it's a crucial part of defensive play.
As noted above, the defenseman blocked a shot thus it counts as a blocked shot in his stats. If he was on the ice when the opponent scored a goal, it would negatively affect his plus/minus rating (and his team mates).
What about the Last Line of Defense: Goaltending?
The goalie, the last line of defense, has a unique set of statistics. Suppose in our game, the goalie for Team B faces 30 shots and allows 2 goals. His save percentage, a key statistic for goaltenders, would be calculated as the number of saves divided by the number of shots on goal. In this case, he made 28 saves on 30 shots, so his save percentage would be 28/30 = 0.933 or 93.3%.
If the game ended with a score of 2-1 in favor of Team A, the goalie's Goals Against Average (GAA), another crucial goaltending statistic, would be calculated based on the total number of goals allowed (2) over the length of the game (usually 60 minutes in regulation time). It represents the average number of goals the goalie would allow if he played a full 60-minute game.
Moreover, if the goalie made a particularly impressive series of saves during a penalty kill, those saves would also count towards his penalty kill save percentage, a subset of his overall save percentage that specifically focuses on how well the goalie performs when his team is down a player.
Summary
In hockey, every swipe of a stick, every dash down the ice, and every shot on goal can be quantified, leading to a fascinating array of statistics. As we've seen, these numbers provide a window into the game's complex strategies, intense physicality, and split-second decision-making. So, the next time you're watching a game, remember: behind every stat, there's a story unfolding on the ice. As an aspiring Hockey Analyst, it's your job to tell that story, one number at a time.
At this point, you should be grounded in the game of hockey and are ready to embark onto the next part of the journey: the L100 series. Here, we'll get you more acclimated to the world of Hockey Analytics.
Subscribe to our newsletter to get the latest and greatest content on all things hockey analytics!
Member discussion