Are your Athletes Ready for Game Day?
In this Edition
- What is Sports Science?
- What is a Player Wellness Report?
- Walkthrough: Creating a Player Wellness Report
What is Sports Science?
Sports Science is a discipline that applies scientific principles and techniques to improve sports performance and understand the various factors influencing it. It encompasses a broad range of sub-disciplines, including physiology, psychology, biomechanics, nutrition, and strength and conditioning. Sports scientists work directly with athletes and coaches to optimize training, enhance performance, prevent injuries, and sometimes even focus on rehabilitation.
Below is a sampling of the areas that make up the discipline of Sports Science.
- Physiological Training: Understanding how the body responds to different types of exercise and designing training programs to enhance physical capabilities.
- Biomechanics: Analyzing athletes' movements to improve technique and reduce the risk of injury.
- Nutrition and Hydration: Providing dietary guidelines to optimize performance and recovery.
- Psychological Training: Focusing on mental well-being and strategies to enhance focus, motivation, and coping with pressure.
- Injury Prevention and Rehabilitation: Implementing strategies to prevent injuries and guide athletes through recovery processes.
Analytics and sports science go hand-in-glove, and often times people with these different skill sets collaborate within sports organizations. That is, a sports scientist focuses in many of the areas listed above and a data analyst (or data scientist) supports them through data management, analytical and predictive modeling needs.
One tool where analytics meets sports science is the Player Wellness report.
What is a Player Wellness Report?
A Player Wellness report is an assessment tool used to monitor and manage the health and well-being of players. It integrates various metrics and data points to provide a holistic view of a player's physical and mental status. The primary goal of these reports is to optimize player performance, prevent injuries, and ensure players are in the best possible condition for training and matches.
Player Wellness reports come in different flavors, such as Wellness, Injury Status, Training Load, Performance and Readiness, etc. The below show examples of metrics you might find in a Player Wellness reports.
Physical Health Metrics
- Vital Signs: Heart rate, blood pressure, and oxygen saturation levels.
- Strength and Conditioning Data: Muscle strength, endurance levels, and flexibility scores.
- Recovery Metrics: Recovery rates post-training or post-game, measured using heart rate variability (HRV) and other physiological markers.
- Injury History: Documentation of past injuries, their nature, treatment, and recovery progress.
Performance Metrics
- On-Ice Performance Stats: Goals, assists, shots on goal, ice time, and other relevant performance indicators.
- Fitness Test Results: Results from regular fitness assessments like VO2 max, skating tests, agility drills, etc.
Nutritional and Health Habits
- Dietary Habits: Information about the player's diet, including nutrient intake, hydration levels, and any dietary restrictions or supplements.
- Sleep Patterns: Data on sleep quality and duration, often tracked using wearable technology.
Mental Wellness Indicators
- Stress Levels: Assessments of mental stress, which can be gauged through questionnaires or physiological measures.
- Mood and Psychological State: Regular assessments of mood, focus, and mental readiness for training and games.
Environmental Factors
- Travel Schedules: Impact of travel on player fatigue and jet lag, especially in a league with extensive travel requirements.
- Game Load: Analysis of the physical and mental load of games, including frequency of games and intensity.
Rehabilitation and Treatment Records
- Ongoing Treatments: Information about ongoing treatments for injuries or chronic conditions.
- Physiotherapy and Rehabilitation Progress: Updates on rehabilitation progress, including therapeutic exercises and recovery timelines.
What are the Data Sources for a Player Wellness Report?
Player Wellness reports rely on different data sources to provide a comprehensive view of an athlete's health and performance. These data sources can be categorized into objective measurements (e.g., wearables, software tools, medical assessments, etc.) and subjective assessments (e.g., surveys, interviews, etc.). Here are some examples on how this data is collected.
Wearable Technology
- Fitness Trackers and Smartwatches: Devices that monitor heart rate, sleep quality, activity levels, and steps.
- GPS Units: Used during training and games to track movement, speed, distance covered, and workload.
- Biometric Sensors: Devices that measure physiological data like skin temperature, sweat rate, and muscle activation.
Medical Assessments
- Routine Health Check-ups: Regular medical examinations to assess overall health status.
- Physiological Testing: Tests like VO2 max for cardiovascular fitness, DEXA scans for body composition, and blood tests for nutrient deficiencies or markers of overtraining.
- Injury Assessments: Evaluations by medical staff to diagnose and track the recovery of injuries.
Performance Analysis Tools
- Video Analysis Software: Used to analyze game and practice footage to assess tactical performance and technique.
- Statistical Analysis Programs: Software that processes performance statistics like goals, assists, ice time, etc.
Environmental and Lifestyle Monitoring
- Travel Logs: Information on travel schedules to monitor the impact of travel and jet lag.
- Nutrition Diaries: Records of dietary intake to ensure proper nutrition and hydration.
Psychological Assessments
- Mental Health Questionnaires: Surveys and tools to assess stress, mood, and mental readiness.
- Psychological Counseling Sessions: Conversations with sports psychologists that can provide insights into an athlete's mental state.
Subjective Player Feedback
- Self-Reported Wellness Questionnaires: Daily or weekly surveys where players report on their own perceived levels of fatigue, muscle soreness, mood, and overall well-being.
- Training Load Diaries: Logs where players record their personal feelings about training intensity and recovery.
Coaching and Training Staff Observations
- Observational Data: Coaches and trainers often provide valuable insights based on their observations during training and games.
Collectively, these data sources offer a multi-dimensional view of a player's wellness. By integrating information from these diverse sources, teams can create detailed and personalized wellness reports that guide training regimes, recovery protocols, and game strategies to optimize player performance and health.
Walkthrough: Creating a Player Wellness Report
In this walkthrough, we'll discuss how to create a player wellness report in three steps:
- Mock up a sample of player wellness data
- Clean and transform the data using R an RStudio
- Create a player wellness report using Power BI
We'll start from the sample data and make the assumption that the fictional sports team in this walkthrough, the Alaska Bears hockey team, has a daily mobile survey where the data is captured, stored and available for data analysts/sports scientists to analyze.
A notional architecture for our fictional scenario is below. In this diagram, athletes complete a survey via the Mobile Survey, a service pushes the response to a Cloud database where the daily responses get stored, and then that data is available either via download to a CSV file or directly within a Power BI (or other) dashboard.
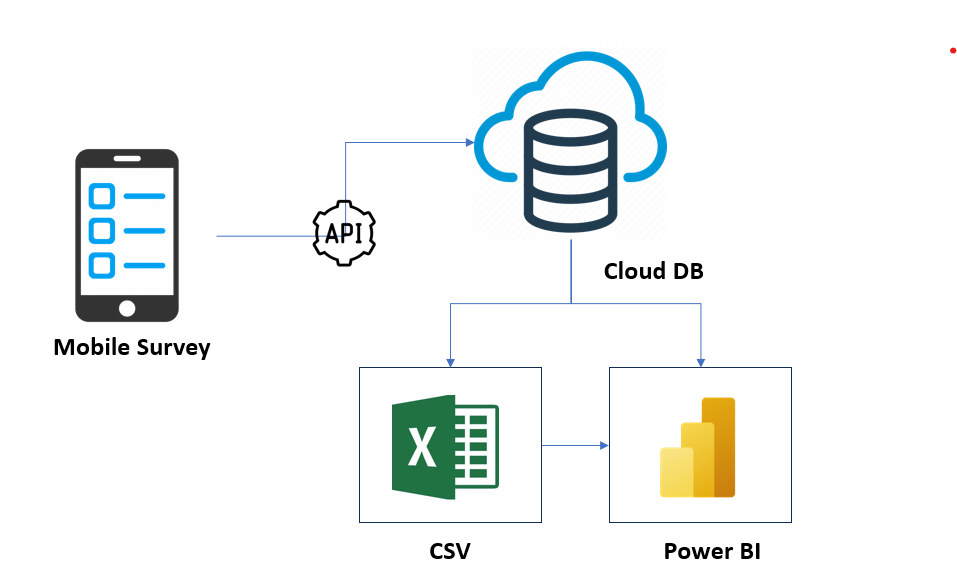
For our walkthrough, we'll start with the data as a CSV file, transform and clean it and then import it into Power BI for final analysis.
Cleaning the Data using R and RStudio
To transform the data, we want to clean up the headers of the CSV, remove any NAs from the dataset, and create an average score across sleep, energy, soreness and mood – our core wellness metrics. We'll also incorporate points scored on a given day to represent player production.
Clean and Transform the Data
In the code snippet below, we start by reading the CSV file into R, updating the column names to be more readable, omitting all of the NAs and normalizing the values to be along a similar scale (1 to 5).

#Read in wellness data.
athlete_wellness_data <- read.csv("Mock_Athlete_Wellness_Data.csv")

#Clean up column headers.
colnames(athlete_wellness_df) <- c("DATE", "SLEEP", "HRV", "RESPIRATION", "RHR", "ENERGY", "SORENESS", "MOOD")

#Remove NAs from file.
clean_athlete_data <- na.omit(athlete_wellness_df)

#Function to normalize key metrics to one scale.
rescale <- function(x, min = 1, max = 5) {
  return((x - min(x)) / (max(x) - min(x)) * (max - min) + min)
}

#Columns to include in the normalization process.
cols_to_scale <- c("SLEEP", "HRV", "RESPIRATION", "RHR", "ENERGY", "SORENESS", "MOOD")

#Call scaling - rescale() - function.
clean_athlete_data[cols_to_scale] <- lapply(clean_athlete_data[cols_to_scale], rescale)
We now have a clean dataset.
Create an Average Wellness Score
At this point, we will create an average wellness score across sleep, energy, soreness and mood. We can use the average score for an aggregated trend. The following code snippet adds a new column to the dataset and creates an average using the four wellness scores.
...

clean_athlete_data$AVG_SCORE <- rowMeans(clean_athlete_data[, c("SLEEP",
"ENERGY", "SORENESS", "MOOD")],na.rm = TRUE)
...
Fit a Points Metric to the Average Score
The last step is to create a POINTS column, so we can analyze the relationship between wellness scores and player production during the game. POINTS is a contrived column; the idea is to randomly create point production with ranges that map to average wellness scores. So, you pass the AVG_SCORE into the function below and based on that average score, a variable is returned and added to the dataset.
...
random_value_based_on_score <- function(score) {
  if (score < 2.5) {
    return(0)
  } else if (score > 2.5 && score <= 3.5) {
    return(sample(0:1, 1))
  } else if (score > 3.5 && score <= 4.2) {
    return(sample(1:2, 1))
  } else {
    return(sample(1:3, 1))
  }
}

clean_athlete_data$POINTS <- mapply(random_value_based_on_score, clean_athlete_data$AVG_SCORE)
...
The final result of the data cleaning and transformation will be something similar to the below, along with an AVG_SCORE column averaging some of the scores and the POINTS column that "maps" point production to wellness score via the AVG_SCORE.
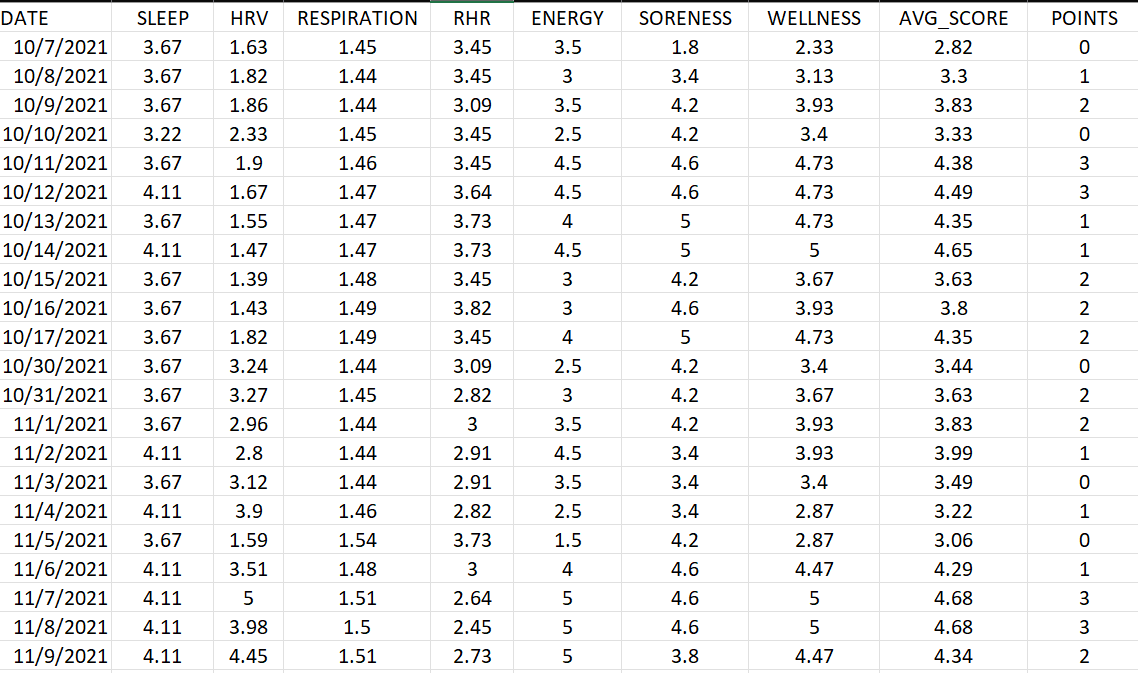
We are now ready to build our dashboard.
Creating a Player Wellness Report using Power
To create the report, we followed a process that took us from goal statement to wireframe mock-up to design to data sourcing and finally to report creation.
We created the report using a background design and five types of controls:
- Card controls (on the left of the dashboard) for summary metrics
- Line chart for a comparative trend view
- Area chart for a single-metric trend view
- Bar chart for a comparative average metric view
- Scatterplot for a relationship comparison
The goal of this report is to provide a summary for the wellness metrics and provide different views on energy, sleep, soreness and mood. For example, the Player Wellness Scores Trend shows a monthly view of the separate wellness scores; the Average Score Trend gives more of an all-up score across that same time-frame (along with a target threshold for the score); the Average Wellness Scores, which compares the average of all four wellness scores; and finally the Average Score vs Game Production, which plots the average score against points.
To create the report, we did the following:
- Imported the wellness data
- Loaded the background
- Added each control, dragging and dropping data to the control
- Configured the controls for data labels, branding, and aesthetics
The resulting report can be seen below.
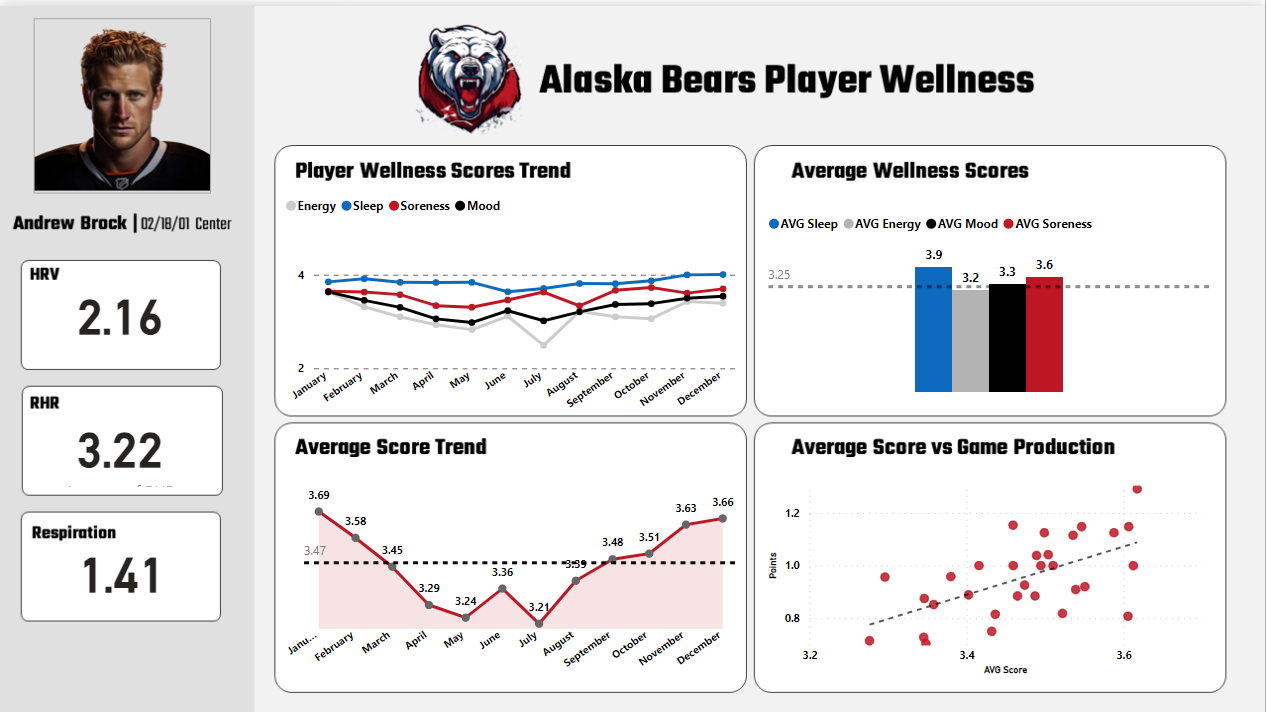
The Player Wellness report provides some key takeaways for our fictional hockey player that we may want to explore:
- His wellness scores generally trended down and then began to improve in August. Was there a change in his training routine? Were there other factors that contributed to this change?
- The average wellness score shows this more prominently representing the average of four scores with one trend. Here, you can more clearly see the dip.
- His energy was on average the lowest of the wellness scores – and had a deeper decline in July. Conversely, his sleep was high. Again, what accounted for the energy decline?
- When his average scores were higher, his point production was high. The inverse was true when his average score was low.

Check out the quick-hit YouTube video below:
Summary
Sports Science is an amazingly interesting space. It integrates different physiological, nutritional and psychological aspects of an athlete with their performance, training, and endurance. Sports scientists who have strong statistical and predictive modeling skills are sought after because of their ability to both work with athletes in situ and interpret their results – statistically, programmatically and via reports.
In this edition, you were introduced to sports science and player wellness reports. We walked you through the creation of a player wellness report that reported on sleep, energy, soreness and mood as core wellness metrics. We also 'fit' a points metric to the average of these wellness metrics to illustrate a positive relationship between wellness and player performance. This was obviously a demo. For a real-world Player Wellness report, things will look a bit different. For example, you might include the ability the filter on team versus player or compare team averages (and rolling averages) such that you can see how player wellness and performance against the broader team's performance.
Subscribe to our newsletter to get the latest and greatest content on all things hockey analytics!