Creating and Designing a Player Performance Dashboard using Power BI
In this Edition
- What is a Player Performance Dashboard?
- How do you Design a Power BI Dashboard?
- Walkthrough: Creating a Player Performance Dashboard in Power BI
What is a Player Performance Dashboard?
A player performance dashboard is a tool designed to consolidate and display statistics and performance metrics that evaluate the performance of hockey players. This type of dashboard is used by coaches, sports analysts, team managers, and even the players themselves to monitor, analyze, and improve performance over time.
Here are examples of different components of a player performance dashboard:
- Key Performance Indicators (KPIs): These are the metrics deemed important for assessing a player’s performance. These might include goals, assists, shots on goal, save percentage for goalies, time on ice, plus/minus rating, penalties, faceoff win percentage, and more.
- Data Visualization Tools: The dashboard employs various charts, graphs, and heatmaps to present data in an easily digestible form. For instance, a line graph could show a player’s scoring trend over the season, while a heatmap could indicate where on the rink a player is most effective.
- Customization and Filtering Options: Dashboards are often interactive, allowing users to filter results by game, season, or specific situations like power plays or penalty kills to analyze different aspects of performance.
- Benchmarks and Comparisons: Players can be benchmarked against their own past performances, league averages, or other players to determine where they stand in different areas.
- Predictive Analytics: Some dashboards incorporate advanced statistical models to predict future performance or outcomes based on historical data.
Player Performance dashboards are used for a variety of reasons, such as:
- Performance Analysis: Coaches and players can identify strengths and weaknesses in individual and team play, allowing them to adjust strategies and focus on areas needing improvement.
- Player Development: By tracking progress over time, a dashboard can be an instrumental tool in a player’s development, providing objective data that can be used to tailor training and development programs.
- Game Preparation: Analyzing the performance of opponents can help in strategizing for upcoming games by understanding their tendencies and exploiting their weaknesses.
- Contract and Trade Analysis: Management can use performance data when considering player contracts, trades, or scouting potential acquisitions.
- Engagement with Fans: Media outlets and teams can use dashboards to engage fans by providing insights into player performance, fostering a deeper understanding and connection to the game.
Overall, a Player Performance Dashboard in hockey serves as an essential tool for leveraging data to enhance the competitive edge of individuals and teams, making informed decisions, and quantifying aspects of the game that were traditionally measured only by observation and intuition.
How do you Design your Power BI Dashboard?
When you first start with Power BI, you're typically not taught how to "design" a dashboard; it's more about data, tiles, visualizations, and so on. However, the design of a dashboard can make a significant difference for your audience.
When starting a dashboard project, you can incorporate a few simple steps in your dashboard creation process to improve the final result. For example:
- Be clear on the objectives and requirements. Reports and dashboards should be scoped and specifically address a question, goal or problem.
- Identify your intended audience. Understand the stakeholders who will consume your dashboard and build a reporting experience that is meaningful for them.
- Choose your metrics carefully. You want to be able to tell a story – even if it's answering a simple question. The dashboard should stand on its own.
- Source and clean your data. This can be a lengthy process, and we cover it in other editions in our AI Hockey Camp series. But, you need good, clean data that answers the question or goal of the dashboard and gives substance to your analytics.
- Sketch out a design. Spend a few minutes with a blank piece of paper or a software tool like Figma or PowerPoint to sketch out what visualizations you want to use. Iterate to get the best visualization and layout.
- Create a background image for your report canvas. Creating a background image can give your dashboard structure, style and simplicity – and reduces the number of active controls on a canvas. Below is an example of a background image that you use as your canvas background.

As a beginner, the above are a good set of steps to get you started. As you mature in your design process (and if you work in a large organization), you will also add in steps like user validation, feedback, testing, data pipeline automation, custom control/visualization development (e.g., D3), end-user training, and so on.
For this walkthrough, the background is simple: it uses a blackened image and a rectangle for the sidebar. With this background, we'll add our slicer to the left of the canvas and then will add other controls in the main canvas area. The darkened image will give the dashboard some texture, but shouldn't be too distracting for the visuals.

Let's jump into the walkthrough!
Walkthrough: Creating a Player Performance Dashboard in Power BI
In this walkthrough, our demo scenario is that we've been asked by management to create a summary dashboard for players. The requirements for the dashboard are straightforward: a player summary dashboard that shows key stats and also allows you to compare individual skaters and positions.
To complete this walkthrough, we'll do the following:
- Source the data for the dashboard
- Lay out the design
- Create a background image for the dashboard
- Import the background and data into Power BI
- Create the dashboard
Let's get started!
Sourcing the Data for the Dashboard
For this walkthrough, we'll export the data from NHL.com and choose the Carolina Hurricanes as our example team. To get the data specific to the Carolina Hurricanes:
- Navigate to the NHL stats page.
- Select Skaters, Carolina Hurricanes in the Franchise drop-down and click Get Stats.
- After the stats load, click Export.
When you open the exported data in Excel, you should see something similar to the below.
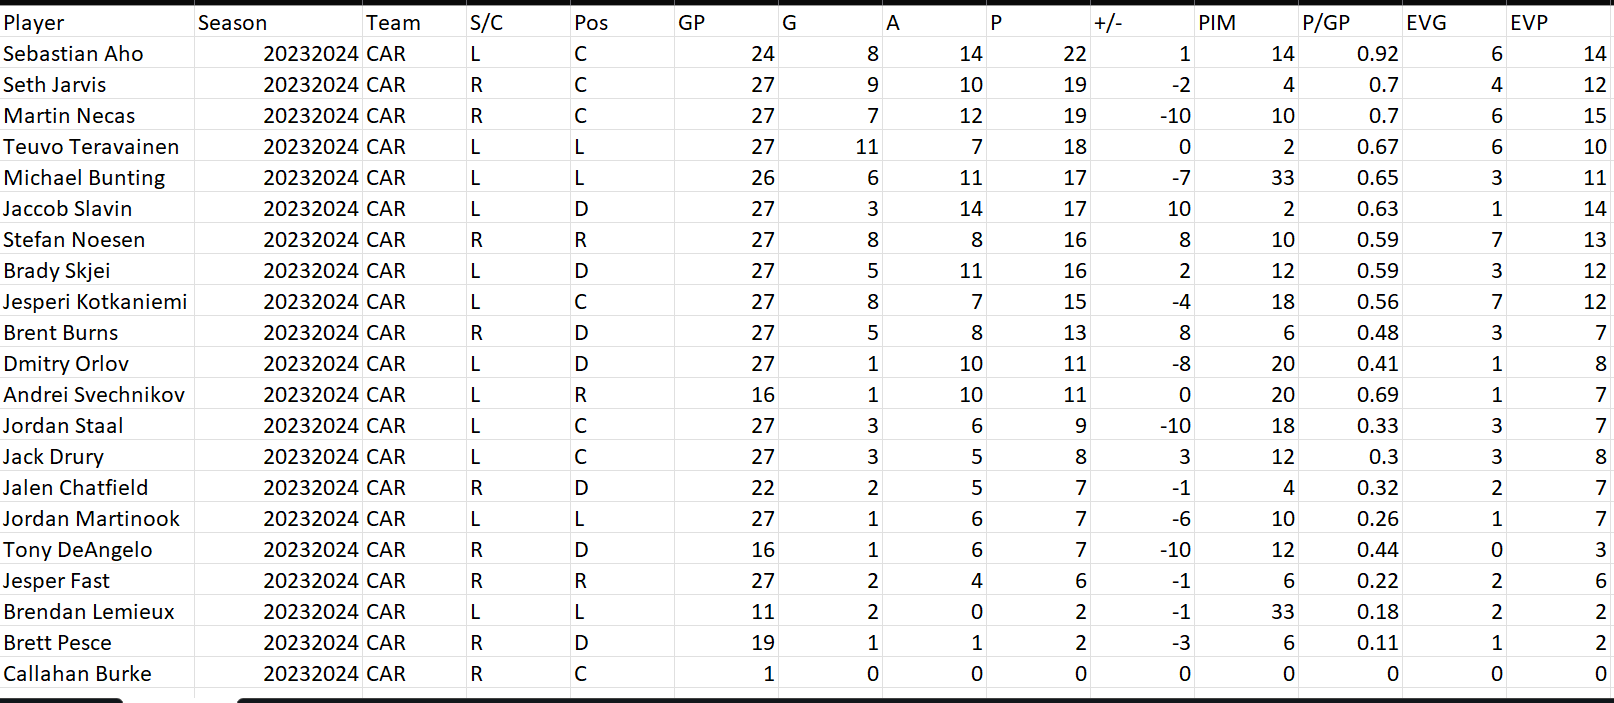
With the data in hand, you are now ready to create your dashboard.
Sketching out the Dashboard Design
Laying out the design of the dashboard before you open Power BI allows you to think through appropriate visualizations and interactivity for the report. You can do this with a pen and paper or software like PowerPoint, Figma or Balsamiq.
We used Balsamiq for our wireframe and based on the requirements came up with a quick design. The flow of the dashboard runs left to right with interactivity using the Position drop-down and Player slicer. Also, the visualizations are simple, not cluttered and give a comparative view of the data.
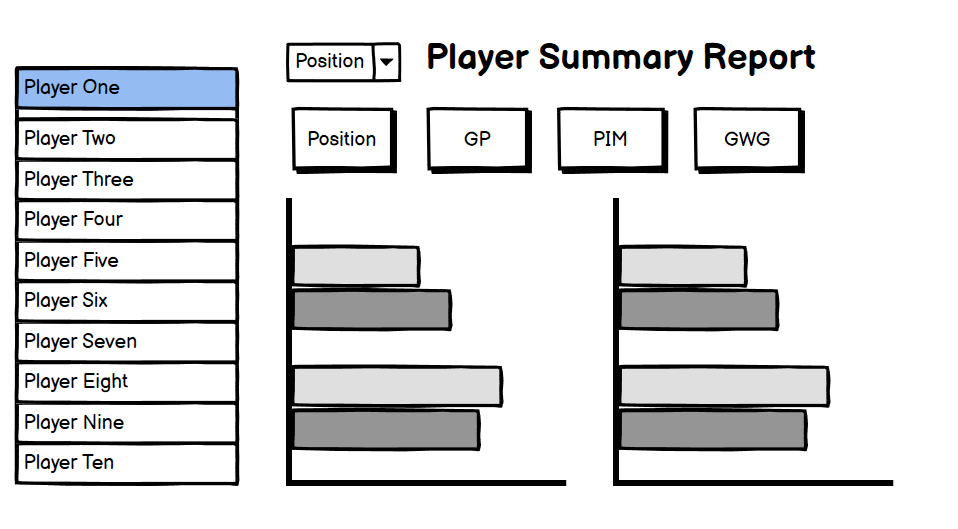
You're now ready to create your background image.
Creating a Background Image using Microsoft PowerPoint
If you have images already, you're set. If not, there are several AI tools out there that generate very cool images. For example, we have used Microsoft Designer and Midjourney and gotten good results. We settled on the image below and then used PowerPoint to create the background image.

To create the background image:
- Open PowerPoint and create a new slide deck.
- Click Insert, Pictures, and This Device. Navigate to the image you want to use for your background and click Insert.
- Click Design and Designer to see if PowerPoint can format the picture for you or recommend a design. If you don't see something you like, format the slide to your liking.
In our slide, we inserted the image and then added a rectangle for the left-hand slicer and then a square shape (with 20% transparency) for the main canvas.

To save as an image, click File, Save As and select PNG and provide a file name.
Importing the Background and Data into Power BI
You are now ready to open up Power BI to create your dashboard. To do this:
- Open Power BI and click Get Data.
- Select Text/CSV, navigate to the exported hockey data and click Load.
The data will now be loaded into the Data pane.
Insert the image as a background by clicking the canvas, Canvas Settings in the Visualizations pane, and in the Image browse field click Add File, select your image and click Open. In the Image Fit drop-down, select Fit.
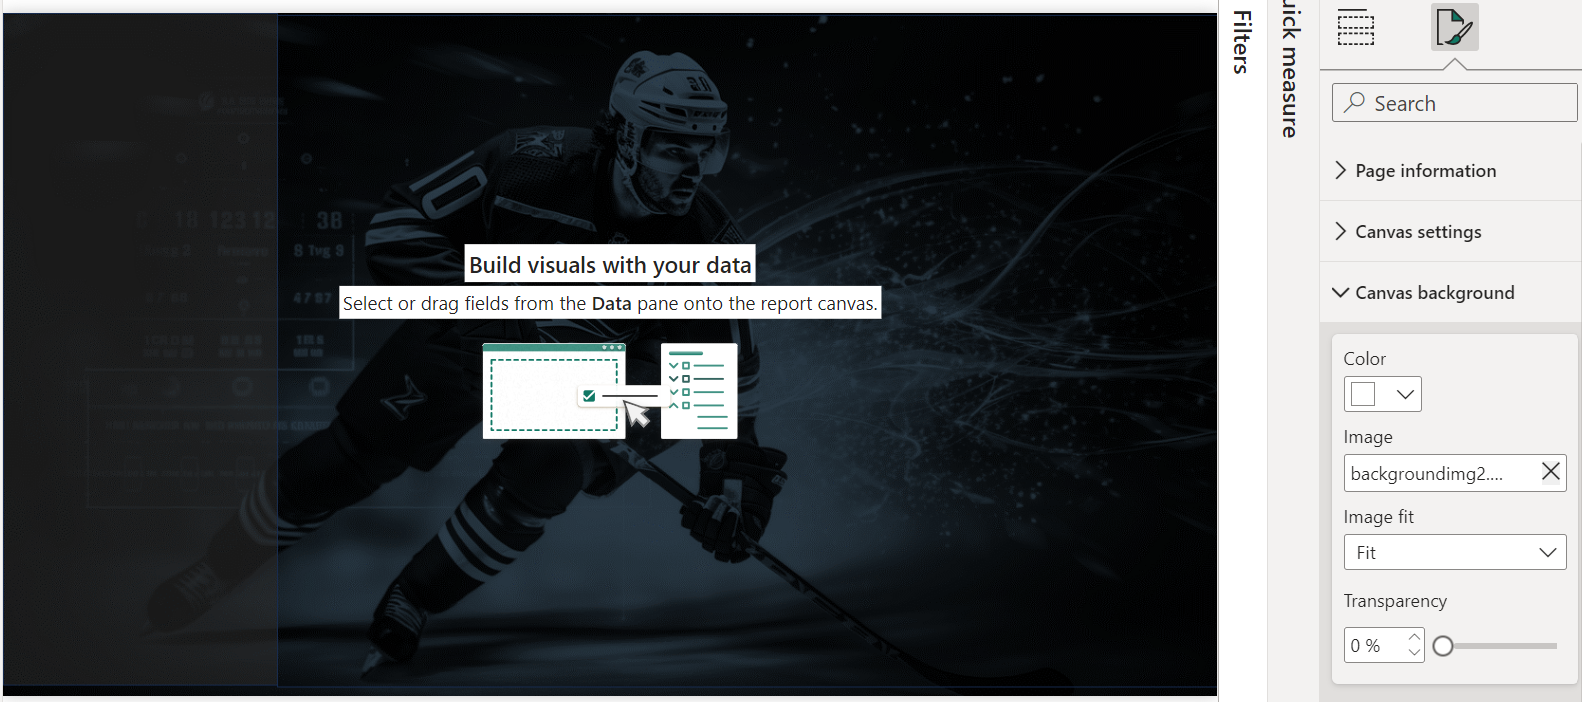
You are now ready to add the controls and data to your canvas.
Creating your Player Performance Dashboard
To create our dashboard, we used the following three types of controls:
- Slicer control – one for players and a second for position
- Card controls – for key statistics and position
- Bar charts – for comparative views of goals/assists and special teams
For each control, we clicked the control in the Visualization pane and then dragged the data from the Data pane into the appropriate fields. We then added some design to the dashboard by customizing the dashboard by team color.
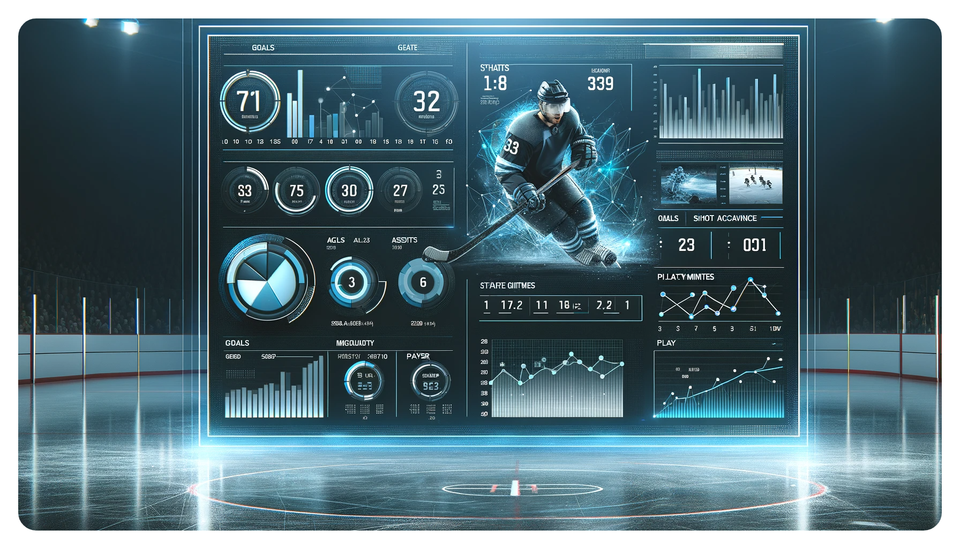
The final result for our 'mock' Player Performance dashboard is below – a functional dashboard summarizing player performance using the branded colors of the Hurricanes.
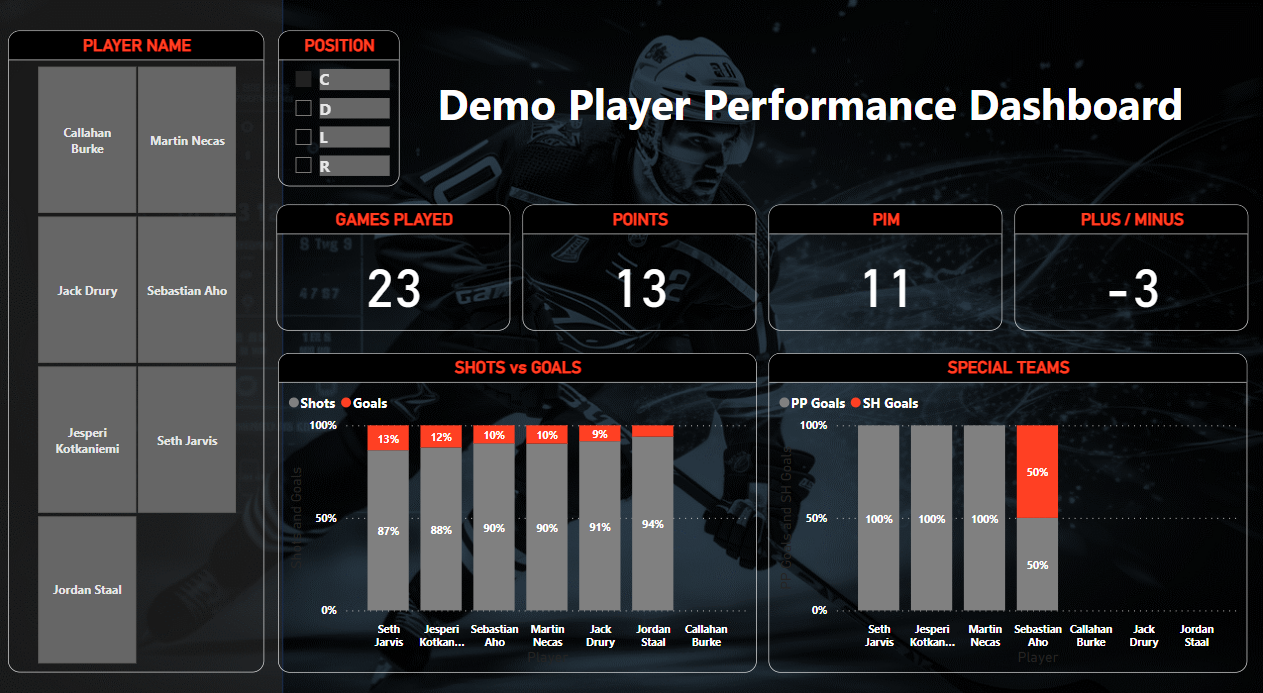
Consumers of this dashboard now have a few capabilities:
- Interactive controls to filter and explore individual players, combinations of players or specific positions.
- Summary statistics such as Games Played, Points, PIM and Plus/Minus.
- Comparative views (stacked bar charts) where you can see shots and goals production and performance on special teams through power play and shorthanded goals.
Check out our quick-hit video tutorial on YouTube:
Summary
In this edition, you learned what a player performance dashboard is and how to build one using a simple planning and design process. We also walked through how to create a 'mock' dashboard emulating a scenario where you're asked to provide a dashboard with specific requirements.
We focused more on design in this edition, giving you a few simple steps to follow when designing your own dashboard. We also cover more of the data and visualization control side of dashboard creation in an earlier post entitled "How can I Create a Team Summary Dashboard with Power BI." You can also check out our quick-hit video on YouTube on creating a power BI dashboard.
Subscribe to our newsletter to get the latest and greatest content on all things hockey analytics!