Ice Breakers: Decoding the Impact of Injuries in Hockey

In this Edition
- Overview of Hockey Injuries
- Common Injuries in Professional Hockey
- Reporting of Injuries in the NHL
- Publicly Facing Injury Reports
- Injury Reporting with Impact Metrics
Overview of Hockey Injuries
For professional hockey teams, two events can potentially cost a significant amount of money. The first is drafting new players. The cost to scout, draft and train new players into a franchise (along with the bet you take on that player) is a costly affair, and a lot goes into this process. The second are injuries. Depending on the status of the player and the nature of the injury, the cost for an injury can range from a single-game miss to a dramatic loss that can last multiple games to a season and impact on-ice performance and ticket sales.
The St. Mike's Canadian Brain Injury and Violence Research Team studied "1,307 high-level players who participated in at least one regular-season NHL game during the 2009-10, 2010-11 and 2011-12 seasons." The study found that "825 of the players – or 63.1 per cent – missed one game or more to injury over that time period." Other findings from the study were as follows:
- The average number of games missed by the injured players was 8.8, or 11 per cent of the regular season.
- The average salary cost for injuries was US $260,300.
- Total salary costs due to injury over the three seasons was $653 million or ~$218 million per season.
- The cost of concussions alone was an astonishing $128.5 million, or an average of $42.8 million a season.
The team conducting the study concluded: "it is an unacceptably high rate of injury for any workplace." We would have to agree.
Common Injuries in Professional Hockey
Injuries in professional hockey leagues are a significant concern due to the sport's high speed, physical contact, and intense competition. The type of injury in hockey can vary widely, encompassing everything from minor bruises and strains to severe, career-threatening injuries. Below are examples of common injuries in professional hockey.
- Concussions and Head Injuries: Given the high-impact nature of hockey, concussions are a significant concern. They can result from hits to the head, falls, or collisions with the boards or other players.
- Upper Body Injuries: These include injuries to the shoulders (such as dislocations and separations), arms, wrists, and hands. They often occur from hits, falls, or blocking shots.
- Lower Body Injuries: Common lower body injuries include sprains and tears of ligaments in the knees and ankles, groin strains, and hip injuries. These can result from skating movements, collisions, or sudden direction changes.
- Facial Injuries: Pucks, sticks, and skates can cause facial injuries, ranging from broken teeth and jaws to lacerations and eye injuries.
- Muscle Strains and Tears: These are common in the back, groin, and hamstring areas, often resulting from overexertion or awkward movements.
- Fractures and Broken Bones: High-impact collisions or being struck by a puck or stick can lead to fractures.
- Lacerations and Cuts: Sharp skates and equipment can cause cuts, which, while usually not serious, can sometimes lead to significant blood loss or infections.
An article from the Current Sports Medicine Reports notes the following incidence of different injuries in hockey (2017, Mosenthal, William MD et al).
According to the article: "the frequency of hockey-related injuries varies widely in the literature given heterogeneity of exposure estimation, study design, and definition of injury. That said, the article "offers a basic review of common injuries that will present to the sports medicine physician responsible for hockey teams." In the least, this gives us a sense for common injuries that present across a sample of NHL hockey players.
Reporting of Injuries in the NHL
The depth and nature of injury reports vary depending on whether you work for a professional hockey team or you only have access to publicly-available reports. A player's state of health is a confidential matter for teams to manage across their trained staff – be it doctors, physical therapists, counselors, and the like. So, oftentimes the public won't see (nor should they) the health and injury details of a player.
The NHL does have specific protocols for reporting injuries, some of which are listed below.
- General Terms: NHL teams are known for using vague terms when reporting injuries, such as "upper body" or "lower body" injuries, without specifying the exact nature or severity. This practice is partly to protect players from becoming targets for opposing teams but can be frustrating for fans and analysts.
- Concussion Protocol: The NHL has a concussion protocol that teams must follow, which includes specific steps for diagnosing and treating concussions. However, the exact details of a player's condition are often not publicly disclosed.
- Injury Lists: The NHL uses injury lists, such as the Injured Reserve (IR), to officially acknowledge when a player is injured and cannot participate in games. The IR requires a player to miss a minimum number of games, but specific injury details are often not provided.
- Media Reports and Team Announcements: Detailed information about injuries sometimes emerges through media reports or official team announcements, especially if a player is expected to miss a significant amount of time.
- Postseason Disclosure: It's common for teams and players to disclose more detailed injury information after the conclusion of their playoff run or season, revealing the extent of injuries played through during the season.

Publicly Facing Injury Reports
The previous section raises the question of how you determine the impact of a player's injury by only using publicly available information? And can you estimate the impact at both the player and team level?
To evaluate, let's first look at a sample of publicly-available injury reports. For example, CBS Sports provides a daily snapshot broken out by team. Here you can see data for the Anaheim Ducks, which includes the player name, position, updates by date and nature of injury, and notes on the injury status.

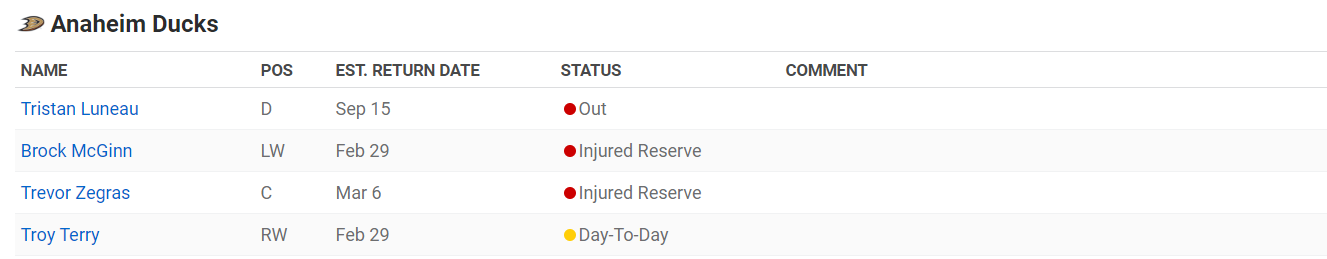
Another example is ESPN Sports. Here, again, we're looking at Anaheim Ducks and can see that most of the information is similar to the CBS example, though here we have "Est. Return Date" in place of an "Updated" date. You also have a drill-through to get more information on the player.
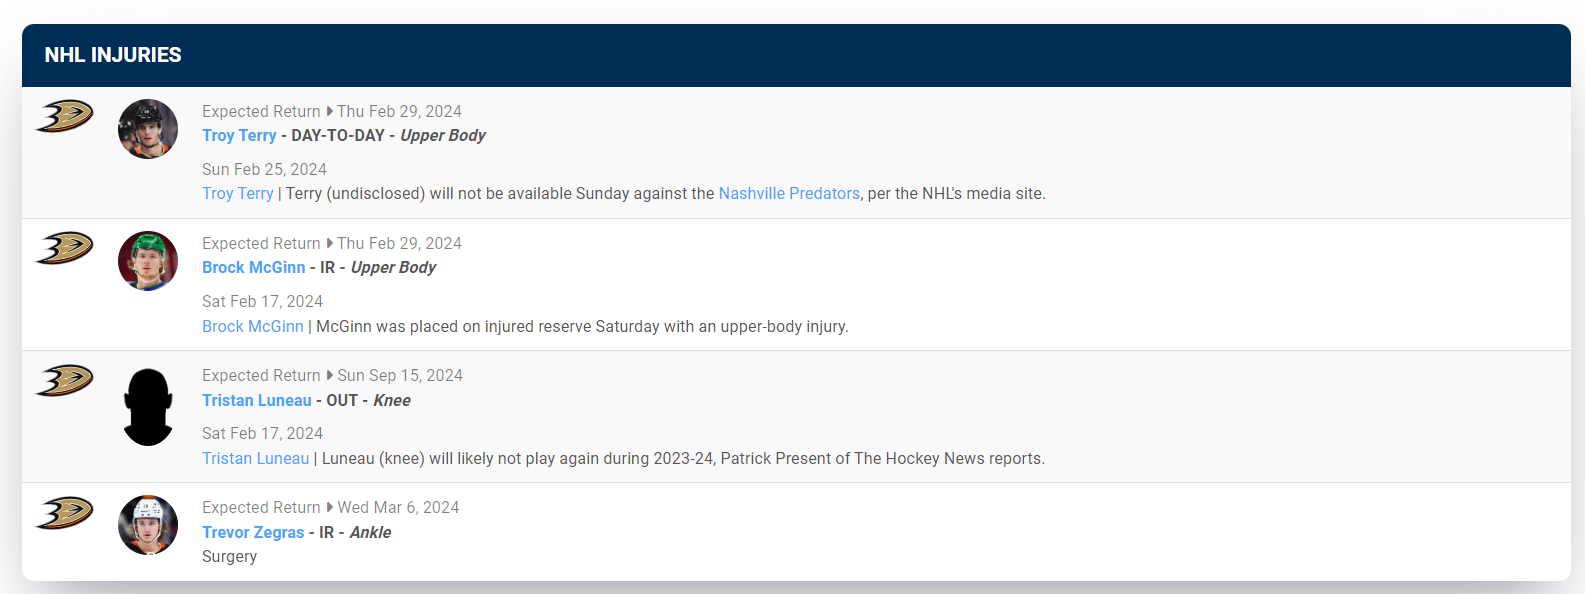
Our final example is PuckPedia Sports. Again, we see similar information but on PuckPedia, the formatting is a bit cleaner and easier to read and includes head shots of the players.
What's good about these reports is that they provide a point-in-time update as to who's out, why they're out and in some cases for how long they are estimated to be out. However, it's tough to assess the impact of the injuries, for example, at the player level, team level or over a period of time.
To better understand the impact of injuries, here are three flavors of reports that you could create.
- Total Count of Injuries by Team (e.g., by game, week, season, etc.)
- Total Injuries over Time (e.g., by week, season, home/away games, etc.)
- Production Cost of Injuries (e.g., points per game lost, time on ice impact, etc.)
Let's explore each of the above report types in more detail.
Injury Reports with Impact Metrics
Total Count of Injuries by Team
The first report mentioned above is Total Count of Injuries by Team. Ideally, you can create a view for periods of time, so you can get a snapshot for the day, for the week or for the season. For example, the bar chart shows the total count of injuries by team for a single game day.
Here are some of the potential benefits you could get from this flavor of report – especially when you integrate other hockey statistics into the report:
- Team Performance Analysis: Understanding the correlation between the number of injuries and team performance can help you identify how injuries impact a team's success in the season. Teams with higher injury counts might show a decline in performance, affecting their standings and playoff prospects.
- Player Management Insights: The report can highlight teams with high injury rates, prompting a deeper analysis into player usage, training practices, and recovery protocols. Analysts can advise on player rotation and load management strategies to minimize injury risks.
- Risk Assessment: By identifying teams with frequent injuries, analysts can assess the risk levels associated with certain teams or playing styles. This information is useful for player agents, scouts, and even betting agencies.
- Injury Prevention Strategies: The report can help in developing targeted injury prevention programs by identifying the most affected teams. Analysts can work with medical and coaching staff to tailor conditioning and rehabilitation protocols.
- Financial Implications: For front office executives and team owners, understanding the injury landscape can aid in financial planning, insurance considerations, and player contract negotiations, especially for teams with high injury counts.
To generate an injury report similar to (or building upon) the Total Count of Injuries per Team for the current season, you'd need some or all of the following data:
- Injury Data: Records of each injury incident, including the date of occurrence, type of injury, player affected, and duration of absence from games.
- Team Information: Data on each team, including the team name, roster, and any relevant changes during the season that might affect injury analysis (e.g., trades, player acquisitions).
- Game Schedule: Information on the season's game schedule, including the number of games played by each team, to contextualize the injury count in terms of games played and potential risk exposure.
- Player Playing Time Data: Information on player minutes, shifts, or games played to analyze the correlation between player playing time and injury incidence.
- Historical Injury Data: For comparative analysis, historical injury data can help identify trends, improvements, or deteriorations in team injury counts over multiple seasons.
Total Injuries over Time
The second report is Total Injuries over Time and observes injury trends across or within a time period. Here's an overview of the potential benefits for this type of report:
- Trend Analysis: Identifying long-term trends in injury occurrences can help analysts understand if injuries are increasing, decreasing, or remain stable over time. This insight is important for evaluating the effectiveness of injury prevention and management strategies.
- Seasonal Impact Assessment: By comparing injury trends across different seasons, analysts can assess the impact of schedule changes, rule modifications, or other factors on player health. For example, a condensed schedule might lead to an increase in injuries due to reduced recovery times.
- Injury Prevention Program Evaluation: Analysts can evaluate the effectiveness of injury prevention programs by observing changes in injury trends. A decrease in injuries over time may indicate successful interventions.
- Player Welfare and Career Longevity: Understanding injury trends helps in assessing the long-term impact of injuries on player welfare and career longevity. Analysts can advocate for changes aimed at improving player health and extending careers.
- Strategic Planning: Teams can use injury trend data for strategic planning, including roster construction, player acquisitions, and development of training regimens that minimize injury risks.
To create the Total Injuries over Time report, you'd need some or all of the following data:
- Injury Records: Detailed injury data for each season, including injury type, affected player, date of occurrence, and duration of absence. This data should be consistently recorded across seasons for accurate trend analysis.
- Game and Season Information: Data on the number of games played each season, including regular and postseason games, to contextualize injury trends in terms of game density and season length.
- Player Demographics and Positions: Information on player demographics (e.g., age, position, playing style) can help in analyzing injury trends within specific player cohorts.
- League-wide Changes: Information on any league-wide changes that could impact injury trends, such as rule changes, equipment modifications, or changes in playing surfaces.
- Training and Recovery Practices: Data on evolving training, conditioning, and recovery practices can provide context for understanding changes in injury trends.
- External Factors: Consideration of external factors such as global events (e.g., pandemics) that might impact season structure, player stress levels, and consequently, injury trends.
Production Cost of Injuries
Creating a report that juxtaposes player performance (e.g., Point Production per Game) with injuries to evaluate the production loss for a team on a game-by-game basis can provide deep insights into the direct impact of injuries on team performance. For example, below is a bar chart showing average points per game for teams with injuries. This may seem counter-intuitive, but the higher the number, the worse it is for the team – especially if there are multiple injuries. This translates into a larger number of higher-production players on a team's injured list. In short, your good players are out.
Here's an overview of the potential benefits for a report that shows the production cost of injuries through various metrics:
- Quantifying Injury Impact: This report can quantify the impact of injuries on a team's offensive and defensive capabilities by correlating the absence of key players with changes in point production and game outcomes.
- Player Value Assessment: Analysts can better assess a player's value to the team by understanding how their absence affects team performance. This can be particularly useful for contract negotiations and player acquisitions.
- Strategic Planning: Coaches and management can use the report to make strategic decisions regarding player rest, injury management, and game strategy, especially during critical parts of the season or in preparation for playoffs.
- Injury Risk vs. Performance: By analyzing patterns in player performance before and after injuries, analysts can assess whether players returning from injuries regain their pre-injury performance levels or show signs of long-term impact.
- Fantasy Sports and Betting: For fantasy sports enthusiasts and bettors, this report can provide valuable insights into player reliability and potential performance, influencing fantasy draft choices and betting strategies.
To generate a detailed report on Production Cost of Injuries with a focus on point production per game and its correlation with injuries, some or all of the following data would be necessary:
- Player Performance Data: Detailed statistics on player performance, including points scored (goals and assists), time on ice, and other relevant performance metrics on a game-by-game basis.
- Injury Data: Comprehensive records of player injuries, including the start and end dates of each injury, the nature and severity of the injuries, and any related information such as expected recovery times.
- Team Schedule and Results: A full record of the team's schedule, including games played, opponents, and outcomes, to correlate injury impacts with specific games and periods within the season.
- Player Roster Information: Information on the team's roster, including player positions, line combinations, and any changes throughout the season, to analyze how injuries affect team composition and strategy.
- Historical Performance Data: For comparative analysis, historical data on player performance and injuries can help identify trends, recovery patterns, and the long-term impact of injuries on player output.
- Contextual Factors: Additional data that could affect analysis, such as changes in coaching staff, team strategies, or significant league-wide rule changes, should also be considered.
Summary
In this week's newsletter, we explored the nature of NHL hockey injuries and how different sites and platforms report out on them. We discovered that most publicly-available sites give you point-in-time injury reports, but don't necessarily report out on potential impact.
We then provided three example reports and discussed how these reports could give you more information about the impact of injuries on a team or player. These reports were Total Count of Injuries by Team, Total Injuries over Time, and Production Cost of Injuries. We then enumerated the benefits from these reports and the type of data you would need to create them.
For more on how to create an injury report (that includes impact metrics), check out How to Create an Injury Report that Includes Production Costs.
Subscribe to our newsletter to get the latest and greatest content on all things hockey analytics!
Member discussion