What are Common Data Analysis Tools?
In this Edition
- Common Data Analysis Tools & Skills Profiles
- Microsoft Excel
- Microsoft Power BI
- R & RStudio
- Python & PyCharm
Common Data Analysis Tools & Skills Profiles
You will use many tools in your career as an analyst. Some of those tools will source, process and manage data, some will enable you to create visualizations and dashboards, and others will give you the ability to create apps and programs to distribute and leverage those visualizations. This is both the interesting and challenging part about the Sports Analyst and Data Science/Sports Science roles – the sheer breadth of skills, tools and domain knowledge that is required.
If you're just starting your career, you're probably trying to get the lowest cost, but feature-rich tools out there (e.g., Excel, Google Sheets, Power BI, etc.). Your goal is likely more towards learning and building your portfolio or engaging in hobbyist projects. If you're working for a professional sports club or organization, you're very likely using a prescribed set of tools with formalized data management and data pipelines – in an environment that is highly governed (e.g., Excel, Tableau, Qlik, etc.).
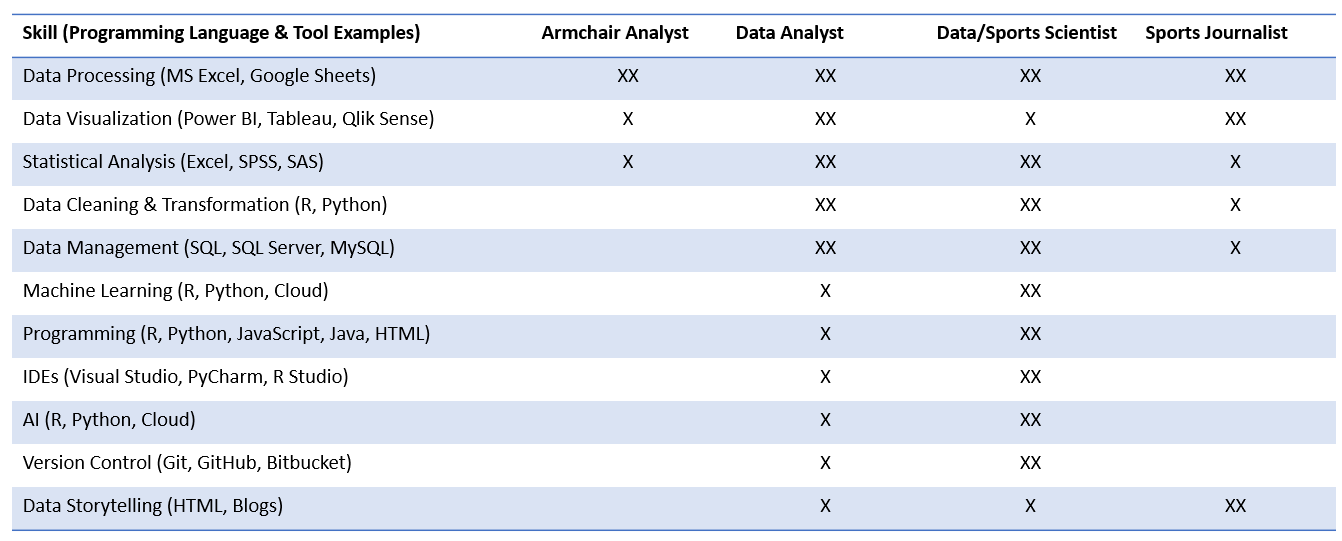
Wherever you are at in your career, different tools require a set of skills and domain knowledge. The table below illustrates the type of skill, programming language and tool a specific profile might use. For example, if you're an Armchair Analyst, then you're likely more of a hobbyist and looking for the most cost-effective way to get your tasks done. If you're a Data Analyst or Data/Sports Scientist, then you require a broader set of skills and knowledge of tools where you will apply those skills.
In this edition, we'll focus on the most cost-effective tools to download, install and use for your hockey (and more generally sports) analytics projects. These tools are:
- Microsoft Excel
- Microsoft Power BI
- R and R Studio
- Python and PyCharm
In future editions, we'll certainly cover other popular tools and programming languages.
Microsoft Excel
Microsoft Excel is an essential tool, no matter where you're at in your analyst career. Excel, a part of the Microsoft Office suite, is a powerful spreadsheet program that has been a cornerstone of business analytics, data management, and simple calculations for over three decades. Excel offers a grid of cells arranged in rows and columns, where each cell contains data, formulas, or functions. Excel also offers a range of tools and capabilities that are especially relevant for hockey analysts.
Below are examples of Excel capabilities:
- Data Entry and Management: Hockey analytics relies on accurate data collection, processing and management. Using Excel, you manually enter game statistics, player metrics, and other relevant data or import it from other sources. The structured layout makes it easy to view, edit, and manage data.
- Formulas and Calculations: One of Excel's strongest features is its formula engine. Hockey analysts can compute averages, percentages, and other metrics by entering formulas. For example, to calculate a player's shooting percentage, an analyst can divide the number of goals by the number of shots taken and multiply by 100.
- Data Visualization: Understanding data often requires more than just numbers; it needs visual representation. Excel provides a wide range of charting tools, from basic pie and bar charts to complex scatter plots and heat maps. Using Excel, a hockey analyst can easily visualize a player’s performance over a season, compare multiple players, or track a team's progress.
- PivotTables: This is a standout feature in Excel, allowing users to summarize and analyze large datasets. For a hockey analyst, this means quickly comparing players' performances, analyzing game-by-game statistics, or even identifying patterns over multiple seasons.
- Conditional Formatting: Analysts highlight specific data points based on criteria. For instance, an analyst might want to highlight players with a shooting percentage above a certain threshold or identify games where a team's possession metrics were particularly strong. This feature makes comparing metrics across teams and players much easier for those consuming your reports.
- Compatibility and Integration: Excel is compatible with numerous third-party tools and software platforms. This means that hockey analysts can pull data from various sources, integrate with other analysis tools, and even export findings to presentation software seamlessly.
- Macros and Automation: With the Visual Basic for Applications (VBA) language, analysts can automate repetitive tasks, customize functions, and build user interfaces for specific analysis tools. This is valuable when processing game data, generating reports, or building custom analytics tools tailored to hockey.
- Collaboration Features: Modern versions of Excel, especially those integrated with Microsoft 365, offer real-time collaboration. Multiple analysts can work on the same spreadsheet, making it easier to collaborate on complex projects or share insights with a team.
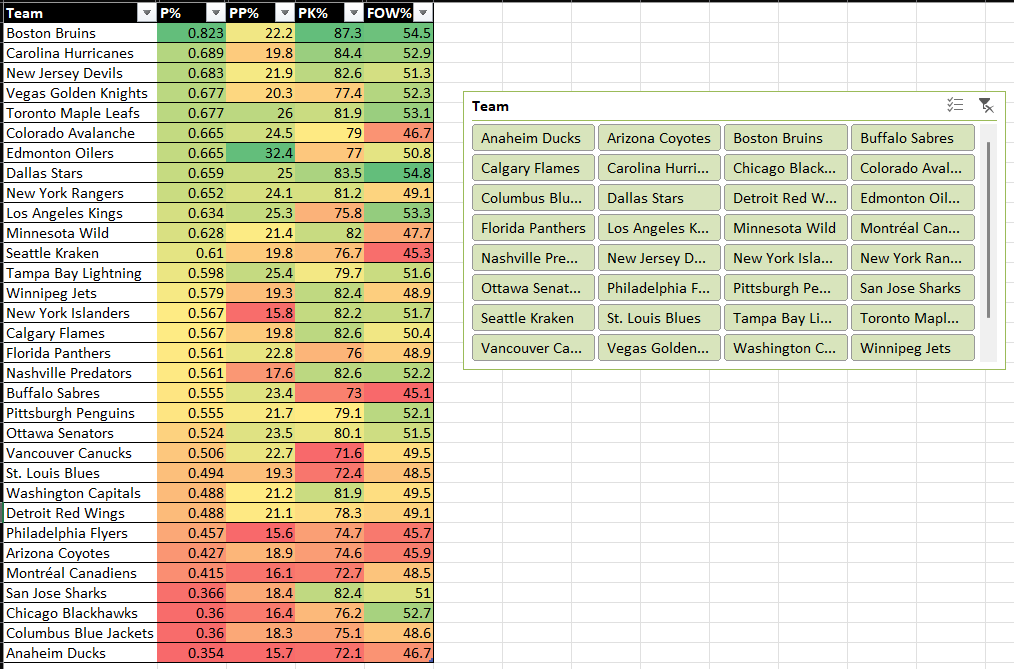
Here's an example of a Team Summary view in Excel with a slicer to filter the view. The conditional formatting provides a visual indication of how well or poorly a metric is performing and makes it easy and intuitive to do high-level comparisons across teams.
Check out the below YouTube video for a quick-hit walkthrough on using Microsoft Excel to create the above Team Stats view with a slicer.
Microsoft Power BI
Microsoft Power BI is a suite of business analytics tools for users to visualize their data and share insights across an organization or embed them in an app or website. With a focus on interactive visualizations and business intelligence capabilities, Power BI provides an intuitive experience that aids in making informed decisions. For hockey analysts, it's a game-changer.
Below are examples of Power BI capabilities.
- Data Visualization: Power BI has robust data visualization capabilities. Unlike static charts, Power BI's visuals are interactive and can be dynamically refreshed. For hockey analysts, this means exploring a player's performance metrics at various game levels, comparing team statistics over seasons, or drilling down to specifics, all within a single dashboard.
- Integration across Multiple Data Sources: Data for hockey analytics might come from various sources, including databases, Excel spreadsheets, Cloud-based apps, or even real-time streaming. Power BI integrates with many data sources, ensuring that analysts have all the information they need at their fingertips.
- Customizable Dashboards: Using Power BI, analysts create tailored dashboards that focus on essential insights. Whether it's tracking a team's defensive patterns, a player's shooting accuracy, or a goalie's save percentage over time, these dashboards provide a consolidated view of the metrics that matter most.
- Advanced Data Modeling: Beyond simple visualizations, Power BI offers advanced data modeling tools. For hockey analysts, this can involve creating complex relationships between datasets, establishing hierarchies, or calculating new metrics based on existing data.
- AI-Powered Insights: Power BI's integration with Azure Machine Learning and other AI capabilities means that hockey analysts can leverage machine learning models to predict game outcomes, identify patterns in player performance, or even scout potential talent based on historical data.
- Geo-Spatial Analysis: Hockey is a global sport, and understanding geographical patterns can be crucial. With Power BI's geospatial tools, analysts can visualize where players are coming from, track team performance based on locations, or even analyze fan engagement across different regions.
- Collaboration and Sharing: Professional Data Analysts and Data Scientists rarely work in isolation. Power BI's sharing and collaboration features ensure that insights are easily communicated across the team or organization. Dashboards can be published to the Power BI service, allowing stakeholders to access them from anywhere, anytime.
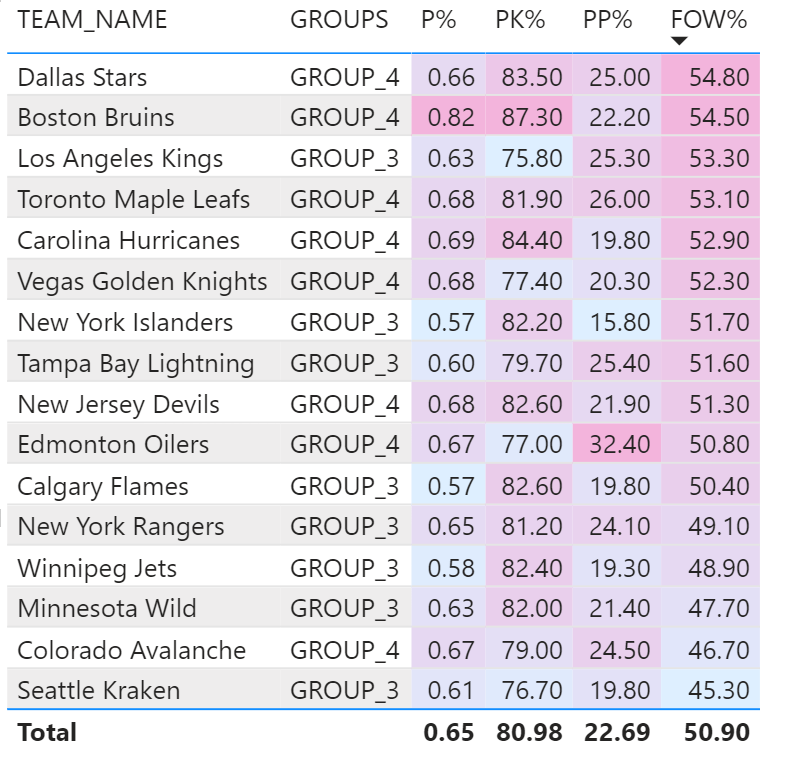
Below is an example of a table in Power BI with a set of hockey statistics and the background color of the cells formatted with conditional formatting for visual comparisons of the data. Power BI is more geared towards dashboards and interactive reports and has a wide array of charts available for you to use.
Check out the below YouTube video for a quick-hit walkthrough on using Microsoft Power BI to create the above Team Performance table with conditional formatting.
R and RStudio
The R language is a leading programming language for data analysis and statistics. It is known for its flexibility, power, and broad open-source ecosystem. RStudio, an integrated development environment (IDE) for R, further enhances its capabilities, making data analysis more accessible, efficient, and visual. For hockey analysts, this combination offers a wide range of advantages.
- Open Source: Both R and RStudio have open-source versions, which means they are free. This is beneficial for independent analysts or smaller hockey organizations that might not have extensive budgets for proprietary software.
- Statistical Capabilities: R was developed with statistics in mind. It boasts a vast array of statistical tests, models, and analyses right out of the box. Hockey analysts can delve into everything from basic statistics, such as mean and variance, to advanced predictive modeling and hypothesis testing.
- Data Manipulation with dplyr and tidyr: The 'tidyverse' collection of packages in R, which includes 'dplyr' and 'tidyr', offers powerful tools for data wrangling. Hockey analysts often deal with messy data – missing values, inconsistent formats, or data spread across multiple sources. With these packages, cleaning and preparing data becomes more straightforward and efficient.
- Data Visualization with ggplot2: 'ggplot2' is a cornerstone of data visualization in R. Its layered approach allows for the creation of complex and aesthetically pleasing visuals. For hockey analysts, this means turning vast amounts of game data into intuitive charts and plots, making insights more digestible for stakeholders.
- Predictive Analytics: R's ecosystem includes packages like 'caret' for machine learning and 'forecast' for time series analysis. Hockey analysts can utilize these tools to predict player performance, model game outcomes, or even forecast ticket sales for future seasons.
- Scalability and Extensibility: R's functionality can be expanded through packages – pre-built libraries of functions and tools. With thousands of packages available on CRAN (Comprehensive R Archive Network) and GitHub, the possibilities are nearly endless.
- R Markdown and Custom Reporting: RStudio supports R Markdown, a format that allows for the integration of code, results, and summaries in a single document. For hockey analysts, this means creating dynamic reports where data analysis and insights are presented side by side. Such reports can be exported as HTML, PDF, or web apps.
- Interactive Web Apps with Shiny: The 'Shiny' package in R allows analysts to create interactive web applications without extensive web development knowledge. Hockey analysts can develop dashboards where coaches or team managers can interact with the data, adjust parameters, and view real-time results.
Check out the below YouTube video for a quick-hit walkthrough on using R and R Studio to analyze team stats distribution using a boxplot.
Python and PyCharm
In the domain of programming, Python is a versatile and powerful language, renowned for its simplicity, flexibility, and vast ecosystem. PyCharm, a popular integrated development environment (IDE) for Python, further augments its strengths, offering a suite of tools designed to streamline the coding process. For hockey analysts, diving into this combination can be a game-changer.
- Intuitive Syntax and Readability: Python's clear and readable syntax ensures that even those new to programming can quickly grasp its basics. For hockey analysts transitioning into data science, this ease of learning means they can focus more on the analytics and less on wrestling with code.
- Extensive Support for Data Analysis: Python boasts libraries like
pandasfor data manipulation,numpyfor numerical operations, andscikit-learnfor machine learning. These tools allow hockey analysts to process game statistics, analyze player metrics, and even predict future performances with relative ease. - Data Visualization: Visualizing data is pivotal in sports analytics. With libraries like
matplotlibandseaborn, analysts can create a myriad of plots, from basic line graphs to intricate heat maps, elucidating patterns in player performance or team dynamics. - Advanced Analytics and Machine Learning: Python's ecosystem is ripe with advanced analytical tools. With libraries like
statsmodelsfor statistical tests andtensorfloworpytorchfor deep learning, hockey analysts can delve deep into predictive modeling, player clustering, or even game outcome simulations. - Web Scraping and Data Collection: Collecting hockey data can often involve extracting information from websites. Python's
BeautifulSoupandScrapymake web scraping more manageable, allowing analysts to gather vast amounts of game data without manual entry. - Interactive Environment: PyCharm offers an interactive coding environment, complete with code completion, debugging tools, and integrated testing. For hockey analysts, this means faster coding, immediate feedback, and reduced chances of errors.
- Version Control: Keeping track of code changes is crucial, especially when working in teams. PyCharm's integration with version control systems like Git ensures that analysts can manage versions of their analyses, collaborate efficiently, and roll back to previous states if necessary.
- Database and Big Data Integration: Hockey analytics can sometimes involve vast datasets. Python's ability to integrate with databases, coupled with PyCharm's database tools, ensures that analysts can query, manipulate, and analyze large datasets without leaving the IDE.
Check out the below YouTube video for a quick-hit walkthrough on using Python and PyCharm to load multiple seasons worth of hockey data and combine into a single data source file that can be used for analytics, predictive forecasting or machine-learning projects.
Subscribe to our newsletter to get the latest and greatest content on all things hockey analytics!
Member discussion