Can you use Winning Percentage to Predict a Team Winning?

In this Edition
- What is the Pythagorean Winning Percentage?
- How is it Different from the Regular Winning Percentage?
- What Data Do You Need to Calculate the Pythagorean Winning Percentage?
- Practical Walkthrough
In the quest for forecasting team success in hockey, one metric seems to stand out for its statistical robustness and predictive power: the Pythagorean Winning Percentage (PWP). This post delves into the intricacies of PWP, contrasting it with the traditional winning percentage, outlining the necessary data for its calculation, and guiding you through a practical application of the PWP algorithm.
What is the Pythagorean Winning Percentage?
PWP is a sports analytics formula initially devised by Bill James, a baseball historian and statistician, for the sport of baseball. The concept has since been adapted for use in many other sports, including hockey. It estimates the expected winning percentage of a team based on the number of runs, points, or goals they have scored and allowed, rather than their actual win-loss record. The idea is that a team’s skill level is more closely related to their scoring capacity and defensive ability than their winning record, which can be influenced by luck and other factors.
James’s original formula used the exponent 2, which made sense for baseball. However, when the concept is applied to other sports, the exponent often changes to better fit the scoring pattern of the sport. For example, in basketball, the exponent might be closer to 14, and in football, it could be 2.37. This adjustment is necessary because the scoring in each sport follows a different distribution, and the exponent helps to normalize the winning percentage to reflect the differences in scoring between the sports.
In hockey, the PWP is calculated similarly to other sports, but with an exponent that reflects the scoring in hockey. The exponent for hockey has been experimentally determined by various analysts; it tends to range around 2, but it can vary slightly depending on the data set and the era. The Pythagorean Winning Percentage formula for hockey is:
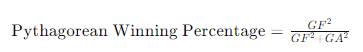
In the formula, GF represents Goals For and GA represents Goals Against. This formula yields a value between 0 and 1, which can be interpreted as the team’s inherent strength or efficiency—independent of luck and other external variables.
The PWP is used to assess a team’s performance quality more accurately than their win-loss record alone. It can help in identifying teams that may have been lucky or unlucky during the season. For example, a team that has won many close games might have a better actual win-loss record than the PWP would suggest; this team might be considered “lucky” and might not be as strong as their record indicates. Conversely, a team that has lost many close games might be stronger than their win-loss record suggests.
Moreover, PWP is often used as a predictive tool by sports analysts and enthusiasts. As it relies on the more stable factors of offensive and defensive abilities rather than the potentially variable actual win-loss record, it can be a better predictor of future performance. Teams whose actual winning percentage significantly exceeds their Pythagorean expectation might be expected to perform worse in the future, and vice versa.
In addition to serving as a tool for analysts, the PWP is also used by team managers and coaches to evaluate the overall performance of their teams. It can inform decisions on what areas need improvement—whether offense or defense—and can be used to set goals and expectations for the team.
How is it Different from the Regular Winning Percentage?
Regular Winning Percentage (RWP) is straightforward—it’s the ratio of a team’s wins to the total number of games played. In other words, it’s the actual winning percentage. Expressed mathematically, it’s:
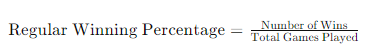
This metric is purely results-based and does not account for the number of goals or points scored or conceded in those games. It’s a direct reflection of a team’s success in terms of game results only.
On the other hand, PWP considers not just whether a team won or lost, but the manner in which those games were won or lost—specifically, it looks at the relative scores. It’s an attempt to measure a team’s underlying performance quality, assuming that a team’s ability to score and prevent scores is a better indicator of their true strength than the win-loss record alone.
The Pythagorean formula is particularly useful for predicting future performance and can highlight whether a team’s win-loss record is sustainable.
Here’s a comparison of the two:
- Regular Winning Percentage:
- Focused on the outcome (win or loss) without context
- Simple and straightforward
- Does not account for how decisive the wins or losses are
- Can be influenced by one-off events, luck, or other factors
- Pythagorean Winning Percentage:
- Attempts to quantify a team’s performance level based on their scoring
- More complex and considers the magnitude of scores
- Suggests what a team’s record “should” be, given their scoring stats
- Seen as a more stable and predictive metric over the long term
PWP can highlight discrepancies between the actual results and the expected level of performance. For instance, a team with a high RWP but a low PWP might be winning games by narrow margins and losing by wide margins, suggesting they may not be as strong as their record indicates. Conversely, a team might have a strong PWP but a poor actual record if they have been losing games by very narrow margins, suggesting they may be better than their win-loss record shows and could see improvement in the future.
What data do you need for the Pythagorean Winning Percentage?
To calculate PWP, you need the following data for each team in the dataset:
- Goals For (GF): The total number of goals scored by the team.
- Goals Against (GA): The total number of goals conceded by the team.
These figures are typically readily available from league statistics and are key to assessing the offensive and defensive strengths of a team. For these calculations, you can use aggregate goals for and against, which are often found in seasonal summary statistics.
For our analysis, we’ll also calculate RWP to evaluate the difference between the RWP and PWP. So, we’ll also need:
- Wins (W): Total number of wins.
- Games Played (GP): Total number of games played.
Practical Walkthrough
We’ll keep the walkthrough simple with three main steps:
- Source one season’s worth of NHL data that includes at a minimum Team Name, Games Played, Wins, Goals For, and Goals Against.
- Calculate RWP and PWP, and then calculate the difference between them. (We will do this in R, but you can easily do this in Excel, Python, or another tool/platform.)
- Explore the results through different visualization.
Sourcing the Hockey Data
For this walkthrough, we used My Sports Feeds, which is a subscription-based data service we use for our projects. Below is a summary snapshot of the 2023–2024 NHL regular season, which includes all the columns we need. It is saved as a CSV file, which we’ll load into RStudio.
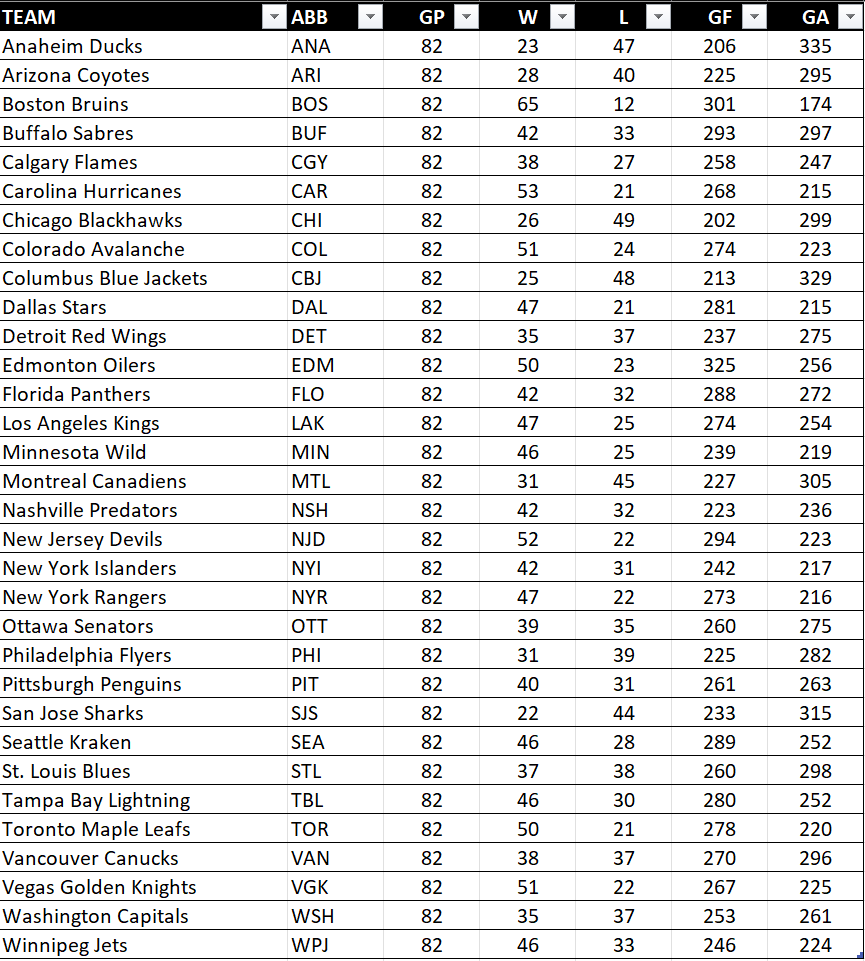
You can create new calculated columns in Excel (or other spreadsheet applications) or programmatically calculate the RWP and PWP columns using R or Python.
Using R to Calculate the Additional Columns
In the code snippet below, you can see several lines of R code. The first line of code loads the CSV file, the following three lines calculate the winning percentage columns and difference column, with the final line of code writing the results to a new CSV file.
# Load the dataset
nhl_data <- read.csv('NHL_Team_Stats_for_WP_V2.csv')

# Calculate Regular Winning Percentage (RWP)
nhl_data$RWP <- round(nhl_data$W / nhl_data$GP, 4)

# Calculate Pythagorean Winning Percentage (PWP)
nhl_data$PWP <- round((nhl_data$GF^2) / (nhl_data$GF^2 + nhl_data$GA^2),4)

# Calculate the difference between RWP and PWP
nhl_data$WP_DIFF <- round(nhl_data$RWP - nhl_data$PWP, 4)

# Save the updated DataFrame to a new CSV file
write.csv(nhl_data, 'NHL_Team_Stats_with_Winning_Percentages.csv', row.names = FALSE)
You can choose to analyze the results in R (which has a great set of visualization libraries like ggplot), but Excel is easy to use, doesn’t require extensive programming knowledge, and has great out-of-the-box conditional and table formatting features.
Analyzing the Resulting Data
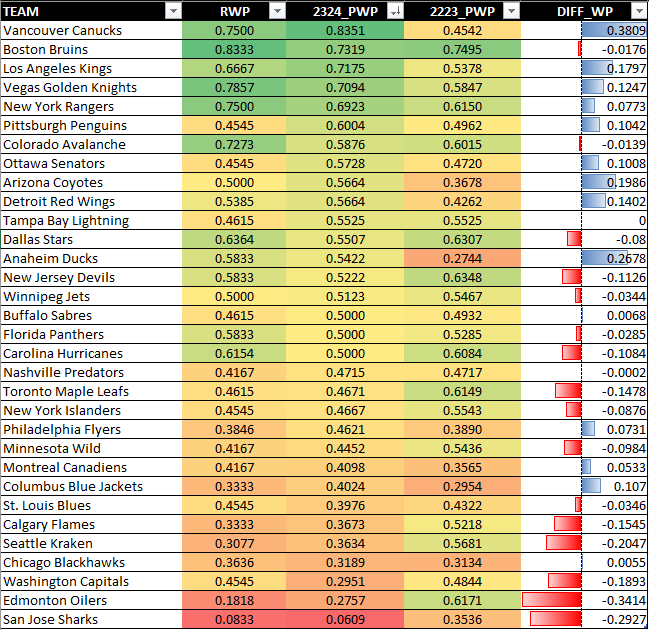
After you have the file written to a CSV file, you can now open it in Excel and work your magic. If you’ve followed along, below is what you’ll likely have. We applied the same color scale conditional formatting to the RWP and PWP columns and then used data bar conditional formatting for the WP_DIFF (difference between Regular and Pythagorean Winning Percentage) column. The result is a decent heatmap that you can sort, compare, and explore. The results below are sorted from largest to smallest in the PWP column.
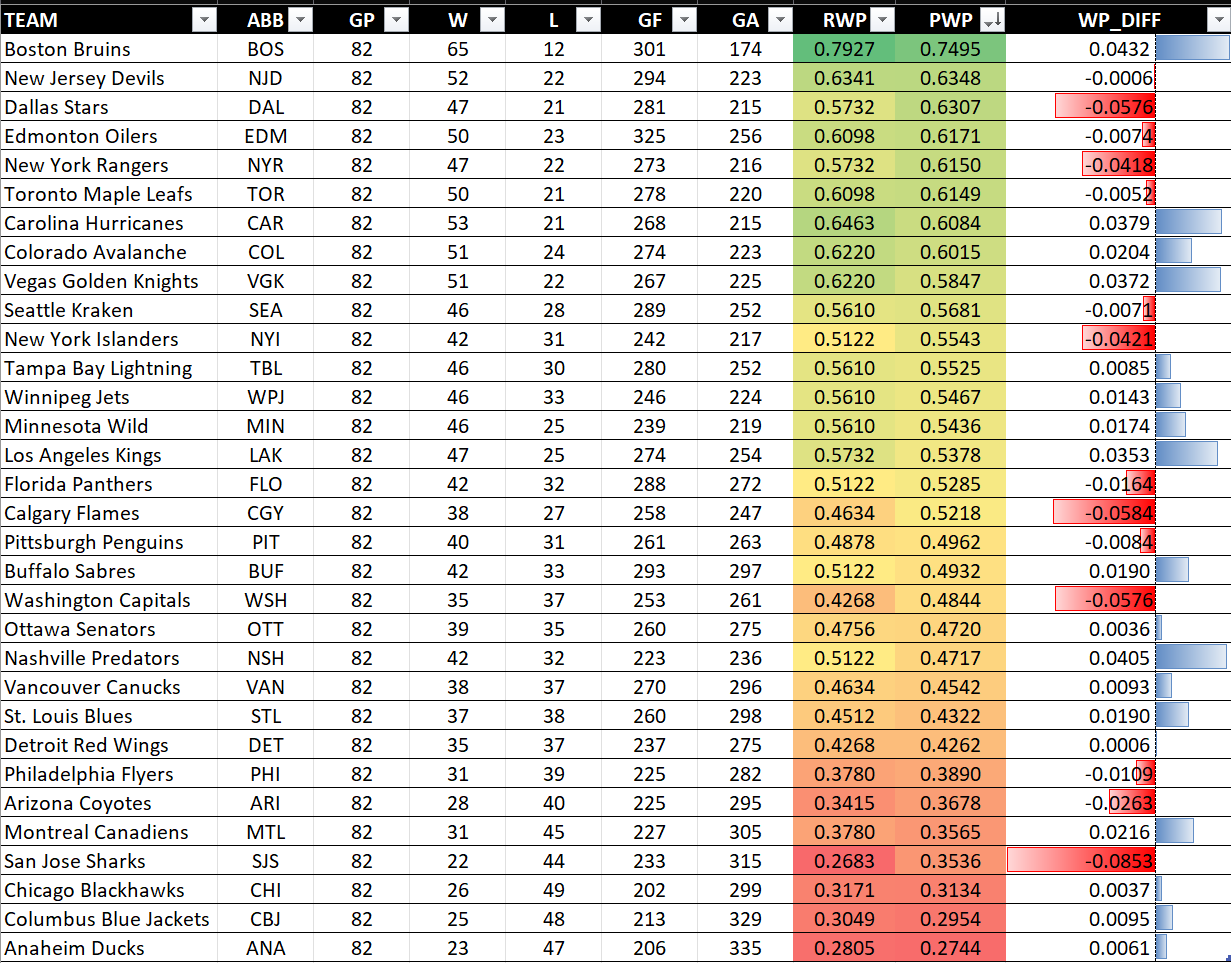
On average, the two winning percentages are relatively close. And this could bear well for the PWP acting as a predictor. However, you should be mindful of other factors. For example, if you use the 2022–2023 PWP values as predictors for the 2023–2024 season, think about the performance and roster changes, which could significantly impact the predictive efficacy of PWP. Assuming levels of cross-seasonal consistency, it’s a useful metric for evaluating the current and potential performance of a team and their ability to win.

Interpreting the Difference between RWP and PWP
From the results table above, here’s how you might interpret the difference between RWP and PWP:
- Positive Difference (RWP > PWP): When the regular winning percentage is higher than the Pythagorean expectation, it suggests that the team may have won more games than expected based on their goals for and against. This could be due to several factors such as winning close games, performing well in high-pressure situations, or perhaps benefiting from a favorable schedule or luck. It might also suggest that the team has a strong defense and goaltending, which allows them to win games even if they don’t score a lot of goals.
- Negative Difference (RWP < PWP): Conversely, if the regular winning percentage is lower than the Pythagorean expectation, it could indicate that the team has lost more games than they “should have” based on their goal statistics. This could be a result of underperformance in critical moments, such as losing games in overtime or shootouts, or it may point to inefficiencies or weaknesses that aren’t apparent just from win/loss records like poor special teams play. This team might be a candidate for improvement, as they are performing well statistically but not achieving the expected results in terms of wins.
A significant difference between RWP and PWP can highlight teams that might be overperforming or underperforming relative to their statistical indicators of performance (goals for and goals against). Over time, teams with a positive difference might regress to the mean (win less), and those with a negative difference might progress to the mean (win more), assuming their goal-scoring and conceding patterns remain consistent.
Validating the Predictive Value of the Winning Percentage
Now that we’ve created a high-level model using RWP and PWP, let’s discuss how you validate it to predict future outcomes.
To validate the PWP calculated for an NHL team using data from the 2022–2023 regular season against the actual outcomes of the current 2023–2024 season, you would follow these general steps:
- Calculate PWP for the 2022–2023 Season: Use the team’s goals for and against from the 2022–2023 season to calculate the Pythagorean expectation.
- Collect Data for the 2023–2024 Season: As the 2023–2024 season progresses, compile the team’s wins, losses, goals for, and goals against.
- Calculate Actual Winning Percentage for the 2023–2024 Season: The actual winning percentage is the number of wins divided by the total number of games played up to the current date.
- Compare Percentages: Compare the PWP from the 2022–2023 season to the actual winning percentage in the 2023–2024 season.
Using similar R code to the earlier code snippet, we loaded the summary stats from this season, calculated the RWP and PWP for this season and included both last year’s (2223_PWP) and this year’s PWP (2324_PWP). The result is below, which is sorted from largest to smallest on the 2324_PWP column. We’re still early in the season, but you can see that significant differences exist with some teams. For example, the Edmonton Oilers are underperforming this year (PWP = 27.57%) compared to last year (PWP = 61.71%). Conversely, the Boston Bruins are more consistent this year (73.19%) compared to last year (74.95%). These numbers are sure to normalize more as the season progresses.
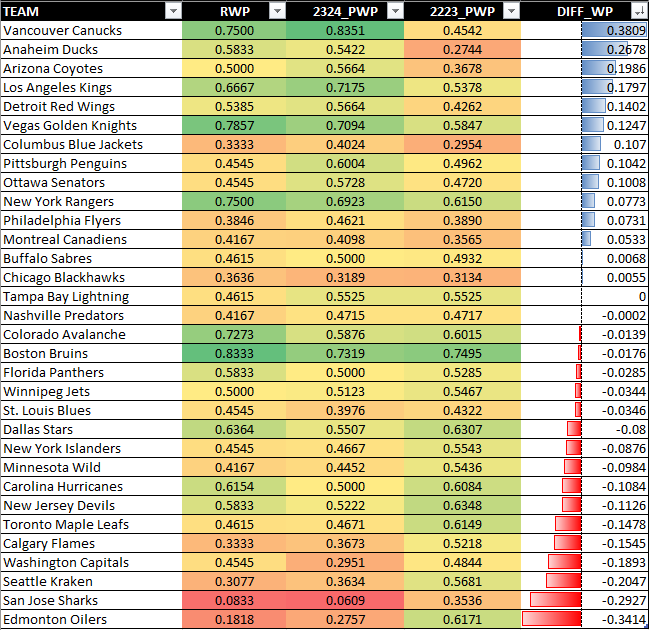
Another view is sorting from largest to smallest on the DIFF_WP column, which shows the difference between last year’s PWP and this year’s PWP (the data snapshot was taken on 11/09/2023). This begins to show you what teams this season are outperforming where they ended up last season. Vancouver Canucks, for example, are outperforming by 38.09%—a very significant jump.

To get under the covers on why requires a more detailed analysis, such as:
- Composition of the team and their production and performance
- Understanding who the teams are playing in the first month of this season
- Off-season trades and staffing changes
Each of the above factors (as well as other factors) could impact both the PWP difference and the applicability of last season’s PWP to this season.
Beyond comparing the differences between PWP, you can also validate the predictable use of PWP through the following:
- Assess the Variance: If the Pythagorean expectation is a good predictor, the PWP for the previous season should be relatively close to the actual winning percentage of the current season, assuming a similar performance level and roster composition.
- Statistical Analysis: To statistically validate the PWP, you could perform a correlation analysis between the PWP of all teams from the previous season and their current winning percentages. A high correlation coefficient would suggest that the Pythagorean expectation is a reliable predictor of a team’s performance.
- Further Considerations: For a thorough validation, it’s important to consider other factors that might affect a team’s performance between seasons, such as changes in the roster, injuries, schedule difficulty, and even luck.
- Iterative Analysis: Since the NHL season is ongoing, the validation process should be iterative. As more games are played, the data set for the 2023–2024 season becomes larger, potentially providing a more accurate validation of the previous season’s PWP.
By comparing these percentages, you can evaluate the predictive power of PWP. If the differences are consistently minimal, it suggests that the Pythagorean expectation is a reliable metric for predicting a team’s performance. However, if there are significant discrepancies, it may indicate that the PWP needs to be adjusted for the specifics of hockey or that the team has undergone significant changes that affect their performance.
Check out our quick-hit video tutorial on YouTube:
Summary
In this edition, we introduced you to the Pythagorean Winning Percentage (or PWP) and compared it against the actual winning percentage called the Regular Winning Percentage (or RWP). We also discussed areas of usefulness and application and then walked you through the calculation of the RWP and PWP and showed you how to do a cross-seasonal comparison.
Remember that while the RWP offers a quick snapshot of past success, PWP provides a deeper, more predictive look into a team’s future performance, making it an invaluable tool in the data scientist’s arsenal for evaluating team strength in hockey.
Here are some additional references if you would like to do some more research:
- Wayne Winston, S. Westler, and K. Pelechrinis, Mathletics (Princeton: Princeton University Press, 2022).
- A Pythagorean Exponent for the NHL. 03/17/2015.
- T. Severini, Analytic Methods in Sports (USA: CRC Press, 2015).
Subscribe to our newsletter to get the latest and greatest content on all things hockey analytics!
Member discussion