Analyzing Shots and their Relationship to Goals
In this Edition
- What are the Different Types of Shots in Hockey?
- What are Important Considerations for Shots?
- What are Shot Statistics in Hockey?
- Walkthrough: Creating a Shot Analysis Dashboard using Power BI
What are the Different Types of Shots in Hockey?
If you're a fan of the sport, then you know the importance of a "shot" in hockey. If you're new to hockey, a "shot" refers to an attempt by a player to score a goal by shooting, tipping or directing the puck towards the opponent's net. This action is fundamental to the game's objective, which is to score more goals than the opponent.
When analyzing shots, context is important. For example, different shots happen at varying distances from the net. As evidence of this, the following visualizations plot the X,Y location for various events – shots, blocked shots, goals, etc. On the left are backhand shots, much closer and tighter to the net, and on the right are snap shots, originating from all over the offensive zone.
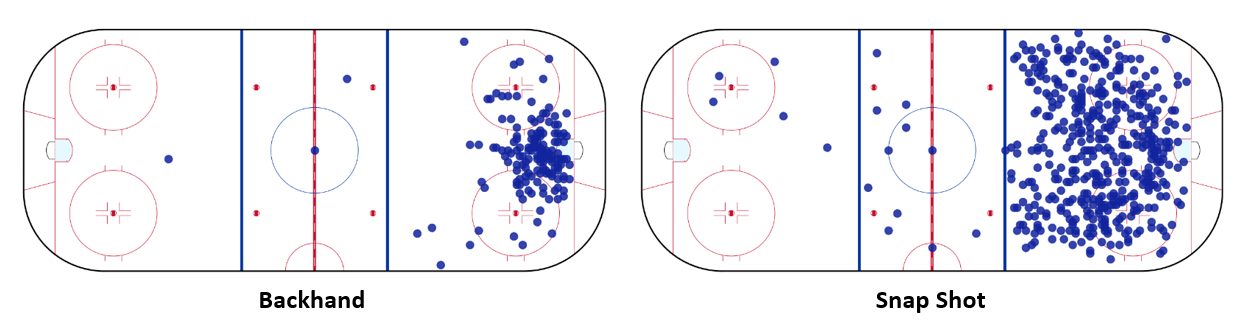
Distance is not the only factor. If a game is tight and clustered, then there's less time to take the shot so snap shots, wrist shots and tip-in shots are more common. Also, if you're close to the net, then a tip-in, backhand or wrap-around shot are more opportunistic.
Players use several different types of shots in hockey.
- Wrist Shot: A common and accurate shot where the player uses a flexing and snapping motion with the wrists to propel the puck. It's known for its precision rather than speed.
- Slap Shot: Involves a wind-up and a powerful downward swing towards the puck, generating high puck speed. It's less accurate but can be very powerful.
- Snap Shot: A quick release shot that combines elements of both the wrist and slap shots. It's faster than a wrist shot but more accurate than a slap shot.
- Backhand Shot: Taken from the backside of the blade. It's often used in close proximity to the net and can be deceptive for goalies.
Each of the above shots are used in different scenarios, which happen at varying distances to the goal. For example, the below is an aggregated view from data collected across multiple seasons and represents the shots recorded, the frequency of those shots and the average distance from the net.
While it's helpful to see the frequency of each type of shot, you're probably asking yourself how likely a shot is to result in a goal. Again, lots of context here, but the below gives you a summary view of the same shots as above, but this time with the percentage of time that shot resulted in a goal.
The "Other" in the above dataset represent a cross-section of other shots that are not typical; however, the largest category of those shots is the open-net goal – which is why the goal conversion percentage is so high for that category.
What are Important Considerations for Shots?
Shot percentage is a key statistic to analyze shots; it is not the only metric, but it's used a lot. The importance of shot percentage can, in part, be reflected through three lens:
- Efficiency Indicator: Shot Percentage, calculated as goals scored divided by total shots on goal, is a direct measure of shooting efficiency. It tells us how often a player's shots result in goals.
- Player Evaluation: It is particularly useful for assessing the goal-scoring prowess of forwards and attacking players. A high shot percentage typically indicates a player who makes the most of their shooting opportunities.
- Comparative Analysis: It allows for the comparison of shooting efficiency between players, which can be particularly insightful when comparing players with similar roles or playing time.
Shot percentage is a regularly collected and reported-on stat. Below is a snapshot of the shot percentage of all NHL teams, including their goals and shots on goal.
However, shot percentage does have its limitations, so it's useful to explore and analyze other metrics alongside it. For example:
- Shot Type: Different types of shots (wrist, slap, snap, backhand) have varying degrees of accuracy and power. A player's shot percentage might be influenced by the types of shots they predominantly use.
- Shot Location: Shots taken closer to the goal generally have a higher chance of scoring. Evaluating where on the ice shots are taken from is crucial for understanding shot percentage.
- Quality of Opposition: The quality of the opposing team, especially the skill of the goaltender, can significantly affect a player's shot percentage.
- Game Situations: Power plays, penalty kills, and even-strength play all offer different contexts for shooting. Players may have a higher shot percentage during power plays due to the man advantage.
- Player Position and Role: Defensemen might have lower shot percentages than forwards because they often take longer shots from the point, while forwards take more shots from closer range.
- Shot Volume: Players with a high volume of shots might have a lower shot percentage simply due to the number of attempts. It's essential to balance shot quantity with quality.
- Historical Performance: Comparing a player's current shot percentage with their historical performance can indicate changes in skill, strategy, or role within the team.
- League Averages: Understanding the league average for shot percentage can provide a benchmark for evaluating a player or team's effectiveness.
- Physical and Mental State: Factors like fatigue, injuries, or confidence levels can affect a player's shooting accuracy and decision-making.
- Team Strategy and Support: The team's offensive strategy and the quality of line mates can influence a player’s opportunities and choices in shooting.
- External Conditions: For outdoor games, weather conditions can impact play. Even in indoor arenas, variations in ice quality can affect shooting.
- Advanced Analytics Tools: Utilizing advanced analytics like expected goals (xG) models, which account for shot location, type, and other factors, can provide a more nuanced view of shooting effectiveness.
In short, shot percentage in isolation can be misleading if not considered within these broader contexts. Effective analysis requires a holistic view that accounts for both the individual player’s characteristics and the various external factors that can influence shooting outcomes.
Let's next explore some other shot statistics in hockey.
What are Shot Statistics in Hockey?
Shot Percentage is often used to represent the quality and conversion of shots to goals, but a variety of shot statistics are used to track and report on players' and teams' shooting performance. These metrics provide insights into different aspects of the game, from offensive prowess to shot quality and goaltending performance.
Here's a comprehensive list of such statistics.
Basic Shot Statistics
- Shots on Goal (SOG): Total number of shots directed at the net that would have entered the goal if not stopped by the goalie.
- Goals: Number of shots that result in a goal.
- Shooting Percentage: Percentage of shots on goal that result in goals (Goals ÷ Shots on Goal × 100).
- Shots Per Game: Average number of shots taken by a player or team per game.
Advanced Shot-Based Metrics
- Corsi: Measures all shot attempts (shots on goal, missed shots, and blocked shots) to assess possession. Often expressed as Corsi For Percentage (CF%) which compares the shot attempts by a team to those of its opponents.
- Fenwick: Similar to Corsi but excludes blocked shots, providing a measure of unblocked shot attempts.
- Expected Goals (xG): Estimates the probability of a shot resulting in a goal based on factors like shot type, distance, angle, and game situation.
- High-Danger Scoring Chances (HDSC): Tracks shot attempts that are considered to have a high probability of becoming a goal, usually from specific areas close to the net.
Goalie-Specific Shot Statistics
- Save Percentage (SV%): Percentage of shots on goal that the goalie saves (Saves / Shots on Goal × 100).
- Goals Against Average (GAA): Average number of goals allowed by a goaltender per 60 minutes of play.
- Shots Against: Total number of shots faced by a goaltender.
Contextual and Situational Metrics
- Power Play Goals/Shots: Goals or shots taken specifically during power play situations.
- Short-Handed Goals/Shots: Goals or shots taken while a team is short-handed.
- Even Strength Goals/Shots: Goals or shots taken during even strength play.
- Shot Attempts During Clutch Situations: Shots taken during high-pressure situations, like the last minutes of a close game.
Miscellaneous
- Shot Distance: Average or specific distance of shots taken from the goal.
- Shot Type Distribution: Breakdown of shots taken by type (e.g., wrist shot, slap shot).
- Time on Ice (TOI) per Shot Attempt: Measures how often a player attempts a shot relative to their time on the ice.
These metrics, when used together, provide a detailed and nuanced understanding of a player or team's shooting performance and overall effectiveness on the ice. They are essential tools for coaches, analysts, and fans for evaluating strategies, player contributions, and game dynamics.
Walkthrough: Creating a Shot Analysis Dashboard in Power BI
This walkthrough will integrate a sample of the shot statistics from the last section into a multi-page report. The goal of the report is to analyze shots of NHL teams using total shots, shot percentage, shot type, and shot location. We built the dashboard using multiple season's worth of of summary data (for total shots, shot percentage and puck possession) and historical data (for shot type and shot location).
Two steps comprise the walkthrough:
- Source and clean the data for the Shot Analysis Dashboard
- Build a dashboard using Power BI
Source and Clean the Hockey Data
For this walkthrough, we used hockey data from Hockey-Statistics. Hockey-Statistics is a treasure trove of data and includes some great blog-posts and how-to videos on Hockey Analytics.
To prepare our data, we 1) transformed and trimmed the original data source (while maintaining its granularity) and 2) used that newly trimmed dataset to create two smaller CSV files. We did this in R and RStudio.
Below is the R code for the first step, where we cleaned and transformed the Hockey-Statistics dataset. It's a large file, but has a reduced set of columns from the source dataset.
library(dplyr)

seasonal_shot_data_df <- read.csv("c:/hockey_data/combined_file.csv")

colnames(seasonal_shot_data_df) <- c("EVENT_NUM", "GAME_ID", "DATE", "AWAY_TEAM", "HOME_TEAM","EVENT_TEAM", "EVENT", "SHOT_TYPE", "IS_HOME", "P1", "P2", "P3", "X", "Y", "DISTANCE", "STRENGTH", "STRENGTH_2", "CORSI", "FENWICK", "SHOT", "GOAL",
"xGF", "xGS", "REVX", "REVY", "HAX", "HAY", "FOR_1", "FOR_2", "FOR_3", "FOR_4", "FOR_5", "FOR_6", "AGAINST_1", "AGAINST_2", "AGAINST_3", "AGAINST_4", "AGAINST_5", "AGAINST_6", "SEASON")

sub_seasonal_shot_data_df <- seasonal_shot_data_df %>%
  select(SEASON, EVENT_NUM, GAME_ID, DATE,
  AWAY_TEAM, HOME_TEAM, EVENT_TEAM, EVENT,
  SHOT_TYPE, IS_HOME, X, Y, DISTANCE, STRENGTH,
  STRENGTH_2, CORSI, FENWICK, SHOT, GOAL, xGF, xGS)

sub_seasonal_shot_data_df <- sub_seasonal_shot_data_df %>%
  mutate(SHOT_TYPE = ifelse(SHOT_TYPE == "0", "OTHER", SHOT_TYPE))

write.csv(sub_seasonal_shot_data_df, "sub_dataset_of_hockey_statistics_full_data.csv", row.names = FALSE)
This gave us our first CSV file. We then created two more CSV files using dplyr in R.
shot_percentage_by_team_season <- sub_seasonal_shot_data_df %>%
  filter(EVENT_TEAM != "#") %>%
  group_by(EVENT_TEAM, SEASON) %>%
  summarize(TOT_GOALS = sum(GOAL, na.rm = TRUE),
            TOT_SHOTS = sum(SHOT, na.rm = TRUE),
            SHOT_PCT = TOT_GOALS / TOT_SHOTS * 100)  %>%
  arrange(EVENT_TEAM, SEASON)

# View the result
print(shot_percentage_by_team_season)

write.csv(shot_percentage_by_team_season, "shot_stats_by_team_and_season.csv", row.names = FALSE)

shot_type_frequency <- sub_seasonal_shot_data_df %>%
  filter(EVENT_TEAM != "#") %>%
  group_by(EVENT_TEAM, SEASON, SHOT_TYPE) %>%
  summarize(Frequency = n(), .groups = 'drop')

# View the result
print(shot_type_frequency)

write.csv(shot_type_frequency, "shot_type_by_team_and_season.csv", row.names = FALSE)
At this point, you should have three data files you can use to build your shot analysis dashboard:
- A granular, event-level view of shot data using Hockey-Statistics as the data source (sub_dataset_of_hockey_statistics_full_data.csv).
- A filtered and grouped view (by team and season) of shot percentage, total shots and goals (shot_stats_by_team_and_season.csv).
- A filtered and grouped view (by team and season) of shot types (shot_type_by_team_and_season.csv).
We've added these curated resources to The Barn.
Build a Dashboard using Power BI
We've written on this several times now, so we'll cover the general steps and refer you to this earlier edition we wrote for more detail: Creating and Designing a Player Performance Dashboard using Power BI.
Given you'll use all of the source files, open Power BI and import them all.
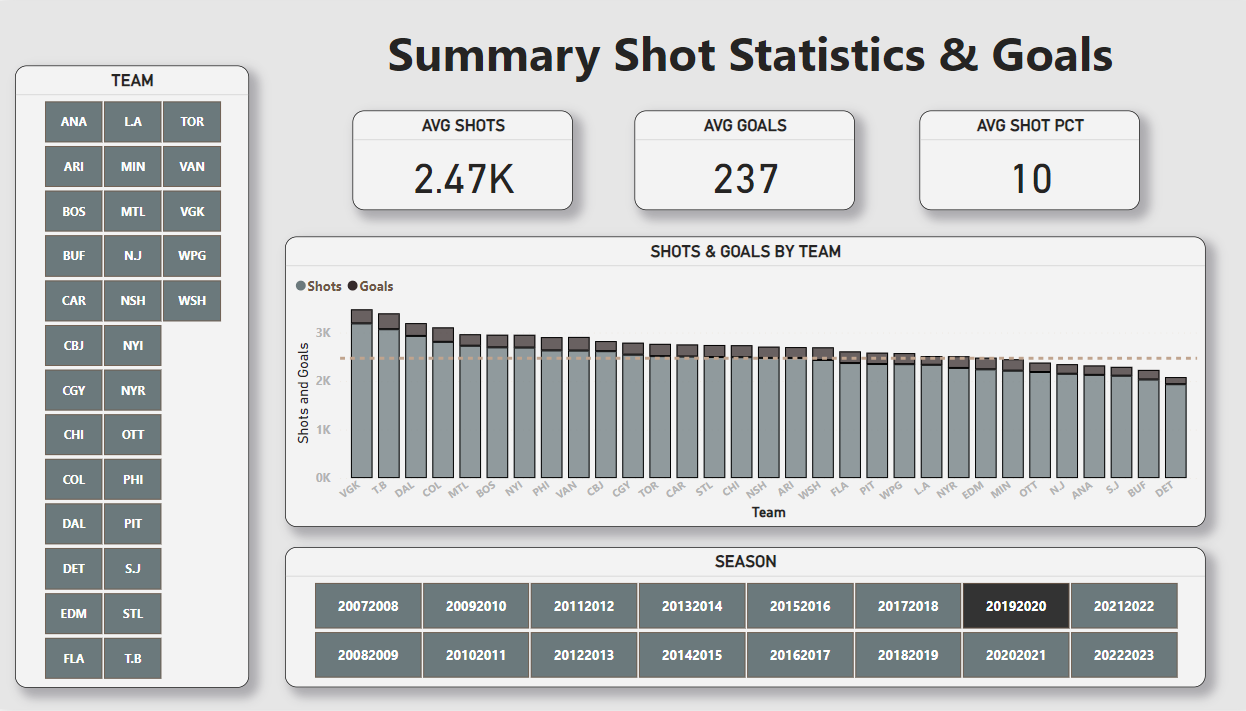
We'll first create a summary shot statistics page using the shot_stats_by_team_and_season.csv file. To do this:
- Open Power BI.
- Add two Slicers, three Cards and one Stacked column chart to the canvas and configure as follows:
- Position one Slicer to the left of the canvas and drag and drop EVENT_TEAM to Field.
- Position the second Slicer to the bottom of the canvas and drag and drop SEASON to Field.
- Position the three Cards along the top and configure them to show average shots (TOT_SHOTS), goals (TOT_GOALS) and shot percentage (SHOT_PCT).
- Position the column chart in the middle of the canvas and drag TOT_SHOTS and TOT_GOALS to that chart.
- Add some formatting to the controls and click View and then Themes to select and apply a design to the report. Note we also added a constant line to the column chart that shows the average shots, so you can see what teams fall above and under this line.
Our finished first report looked something like below.
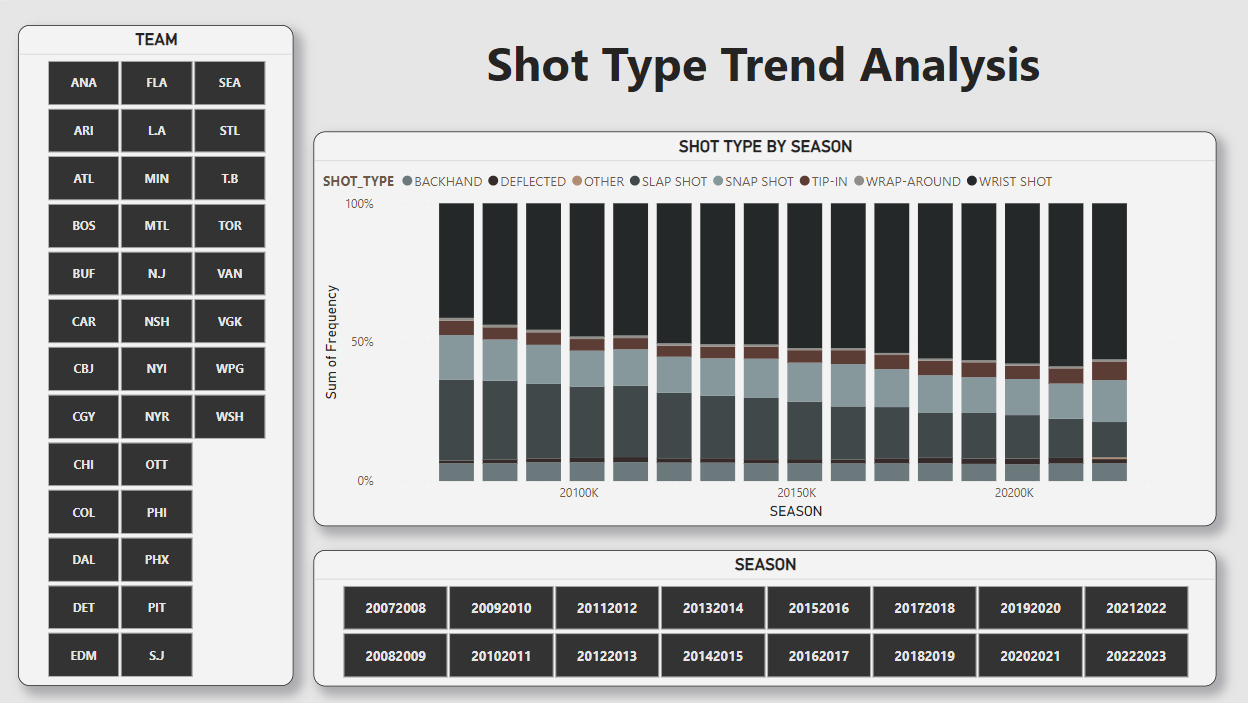
In the second report, we'll create a shot type trend analysis. To do this:
- Add a new page to the dashboard project.
- Import the shot_type_by_team_and_season.csv file into Power BI.
- Add two Slicers and one 100% Stacked column chart.
- Configure one Slicer for EVENT_TEAM and the other for SEASON.
- Configure the stacked column chart to show the different shot types used across each season, so SEASON for the X axis, FREQUENCY for the Y axis and SHOT_TYPE as the Legend.
The second report should look like the below.
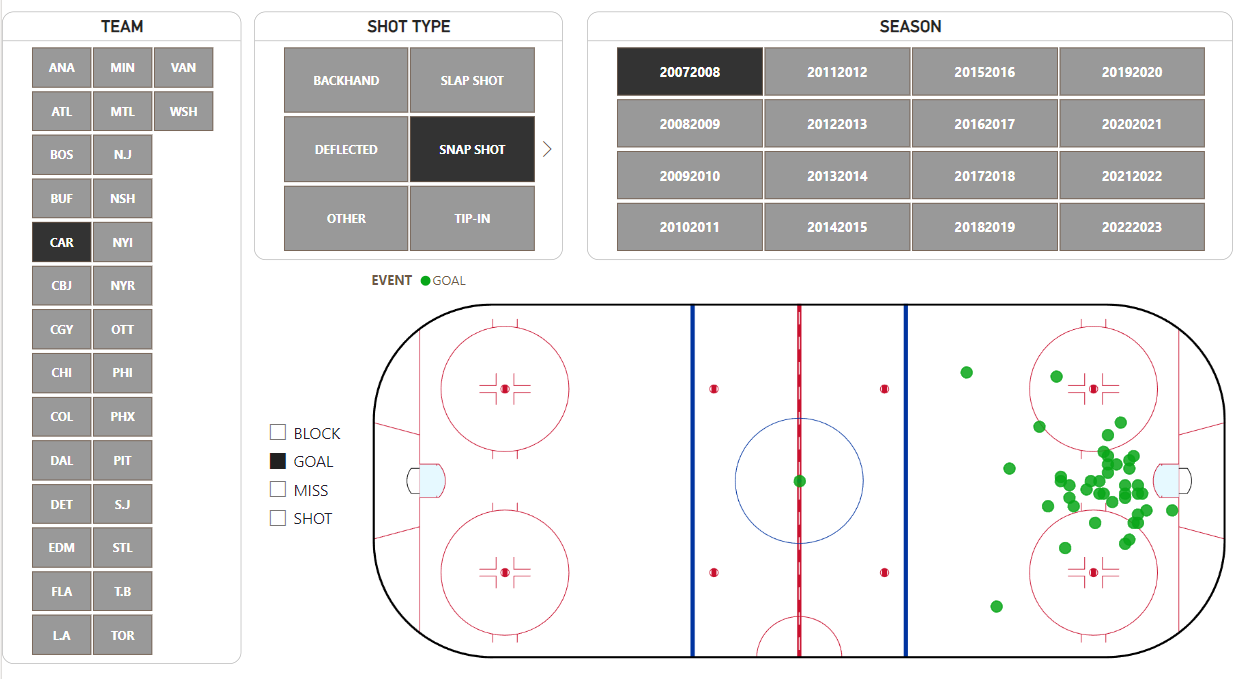
The third report will map the X,Y coordinates of each of the shots taken by the teams across the seasons and plot them on a Scatter Chart.
To create the third report:
- Open Power BI and create a new page.
- Add four Slicer controls and a Scatter Chart to the canvas and configure as follows:
- One Slicer control will be for EVENT_TEAM.
- The second Slicer control will be for SHOT_TYPE.
- The third Slicer control will be for SEASON.
- And the fourth Slicer control will be for EVENT.
- Add X to the X axis of the Scatter Chart, Y to the Y axis and EVENT to the Legend.
- Configure the controls to your liking.
You should end up with something similar to the below.
With the three reports complete, you should now have a multi-page, interactive report where you can explore and analyze total shots/goals, shot types and shot location across multiple seasons and at the team level.
Check out the quick-hit YouTube walkthrough below.
Summary
In this edition, we introduced you to the different types of shots in hockey. We also provided additional context for shots, so you can explore other dimensions to player's or team's shot statistics.
We also built a multi-page report, where we curated the data from Hockey-Statistics and built the report using Power BI. The report comprised three parts: a summary report on shots, goals and shot percentage, a trend analysis of shot types across teams and seasons and a shot location analysis across shot type, teams and seasons.
Additional Resources
Hockey-Statistics is a great resources for hockey analytics, data and more. The below walks you through how to build a player shot location report using Power BI.
Subscribe to our newsletter to get the latest and greatest content on all things hockey analytics!
Member discussion