How will AI Impact Hockey Analytics?
In this Edition
- How will AI Reshape the Analyst Role in Sports?
- What is the Impact of AI on Hockey Analytics?
- Walkthrough: Using Chat GPT to Analyze Team Stats Data
How will AI Reshape the Analyst Role in Sports?
The world of sports is witnessing a transformative era with the integration of Artificial Intelligence (AI) into the game. From player performance analysis to game strategies, AI is reshaping the role of the analyst in sports and revolutionizing areas such as data processing, insights generation, and decision-making.
AI & Data Processing
AI is evolving the way sports analysts process and interpret data. With the vast amount of data available in sports, ranging from player statistics to sensor-generated metrics, AI technologies enable analysts to efficiently manage and analyze large datasets. Machine learning algorithms can handle complex data sets and extract meaningful patterns and trends, saving analysts valuable time and effort.
AI-powered data processing also enhances data integration. Analysts can consolidate and analyze data from various sources, including player tracking systems, wearable devices, and video footage. This integration enables comprehensive analysis and a more holistic understanding of player performance, team dynamics, and game strategies.
AI & Insights Generation
AI empowers sports analysts to generate deeper and more accurate insights from the data. Machine learning algorithms can uncover hidden patterns, correlations, and relationships within the data, providing analysts with valuable information that might not be apparent through traditional analysis methods. This enables analysts to identify crucial performance indicators, key trends, and predictive factors that can significantly impact game outcomes.
Predictive analytics is another area where AI transforms the analyst role. By leveraging historical data, AI algorithms can predict future game outcomes, player performance, and injury risks. Analysts can use these predictions to assist coaches in making informed decisions regarding game strategies, player selection, and tactical adjustments. Predictive analytics also helps analysts anticipate opponent behavior, providing teams with a competitive advantage.
AI & Decision Making
AI technologies enhance the decision-making process for sports analysts and coaches. With advanced analytics and machine learning algorithms, analysts can provide evidence-based recommendations for game strategies, player acquisitions, and talent development. AI-powered models can simulate various scenarios, helping analysts assess the potential outcomes and risks associated with different decisions.
Furthermore, AI can assist in real-time decision-making during games. By analyzing live data streams, such as player tracking and play-by-play descriptions, AI algorithms generate immediate insights and recommendations. Analysts can relay this information to coaches, providing valuable guidance for in-game adjustments and strategic decisions.
Other Areas of Impact
AI's impact on the analyst role extends beyond the teams and into the realm of fan engagement and media coverage. AI-powered tools can enhance the fan experience by providing real-time statistics, interactive visualizations, and personalized content. Analysts can leverage AI algorithms to create engaging content, such as player profiles, historical comparisons, and highlight reels, catering to individual fan preferences.
Media coverage also benefits from AI technologies. Automated systems can generate sports articles, statistical breakdowns, and post-game summaries, augmenting the efficiency and speed of reporting. AI-powered chatbots and virtual assistants can interact with fans, answering queries, providing updates, and engaging in discussions. These AI-driven advancements in fan engagement and media coverage enrich the overall sports experience, bringing fans closer to the game and its analysis.
What is the Impact of AI on Hockey Analytics?
Hockey stands to benefit immensely from AI. In recent years, AI technologies have enabled teams and analysts to gain deeper insights into player performance, strategic decision-making, and overall game analysis. This section explores the impact AI is having on hockey analytics, highlighting its potential to enhance player evaluation, improve game strategies, and ultimately reshape the way the game is played and managed.
AI-powered tools and algorithms have revolutionized player performance analysis in hockey. With the help of machine learning techniques, massive amounts of data, including player statistics, game footage, and sensor data, can be analyzed to uncover patterns, trends, and valuable insights. AI algorithms can quickly process and analyze complex data sets, enabling teams to gain a comprehensive understanding of player performance.
By using AI models, teams can evaluate player performance beyond traditional statistics. Advanced analytics can measure player effectiveness in various game situations, identify strengths and weaknesses, and quantify intangible qualities such as hockey IQ and positioning. AI algorithms can also help predict player development, injury risk, and overall career trajectories, aiding teams in talent scouting, drafting, and contract negotiations.
AI has the potential to significantly advance game strategy and tactics in hockey. Through machine learning, AI algorithms can analyze vast amounts of game footage, tracking player movements and interactions to generate detailed insights. Coaches and analysts can use this information to optimize line combinations, defensive pairings, and tactical approaches for specific opponents.
AI can provide real-time analysis during games, offering instant feedback on player performance and suggesting adjustments to game plans. By utilizing computer vision and natural language processing, AI can process live game data, such as player tracking and play-by-play descriptions, to generate real-time insights and recommendations.
Furthermore, AI can simulate various game scenarios, assisting coaches in developing innovative strategies. By running countless simulations, AI algorithms can identify optimal plays, predict outcomes, and offer recommendations to coaches and players. This enables teams to make data-driven decisions based on probabilities, enhancing their chances of success.
While it's great to talk about all of the possibilities, let's walk through a simple example to show how you can leverage AI to analyze hockey data.
Walkthrough: Using Chat GPT to Analyze Team Stats Data
The example in this section illustrates how you can take advantage of AI when analyzing hockey data. This walkthrough will show you how to 1) source team stats data from NHL.com and 2) use Chat GPT to perform some simple analyses on the data.
Getting the Team Stats Data
To get the team stats data:
- Go to www.nhl.com/stats/teams.
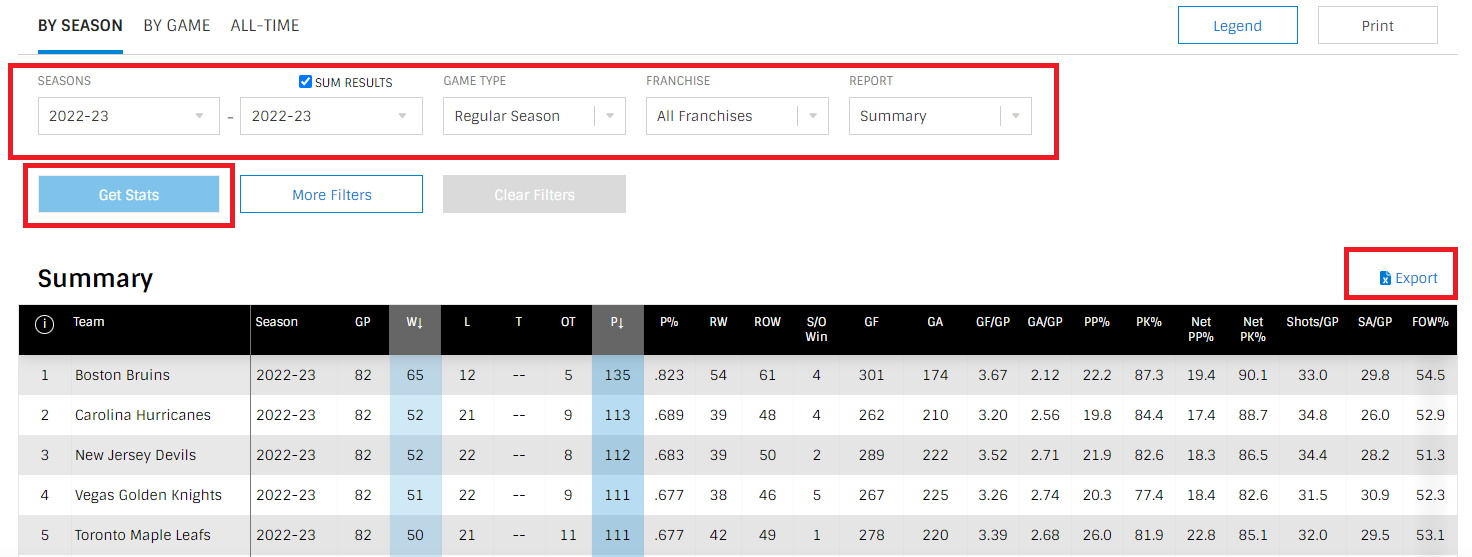
- Filter by the most recent season and select Regular Season in the Game Type drop-down list, All Franchises in the Franchise drop-down list, and Summary in the Report drop-down list.
- Click the Slim Results check box.
- Click the Get Stats button.
- Click Export to export the results as a Microsoft Excel file.
6. Open the exported file on your local computer and then save into a folder as a CSV file.
Analyzing the Team Stats Data File using Chat GPT
Chat GPT is a new generative AI offering from Open AI. It optimizes the way in which you can work in many different ways using generative AI technology. For this walkthrough, we wanted to show how Chat GPT performs the task of exploring a sample set of hockey data.
- Go to the Chat GPT home page (chat.openai.com).
2. Click New Chat in the upper left-hand part of the web page.
3. Click the ellipsis and then Settings in the lower left-hand portion of the web page.

4. Click Chat GPT 4.0 and enable Code Interpreter. You can now upload your CSV file from the NHL.COM web site.
5. Click the + sign at the left of the prompt to upload the hockey data CSV file.

6. Type the following into the Chat GPT text box (or prompt): "Can you do a basic analysis on this data?"
At this point, Chat GPT will inspect the file you uploaded, conduct an analysis on the data and output results for you. The following were the results from our Chat GPT session, which we've broken out into three sections: 1) identifying the data from the CSV file, 2) descriptive statistics, and 3) correlation analysis.
Identifying the Data from the CSV File
The following represents what Chat GPT returned as output from our original prompt. The CSV file contained summary statistics for the 2022-2023 regular season, so Chat GPT did a great job at discerning what each column represented.
The dataset appears to contain information about various hockey teams and their performances in the 2022-2023 season. Here's a brief description of some of the columns:
Team: The name of the hockey teamSeason: The season for which the data is collectedGP: Games PlayedW: WinsL: LossesT: Ties (although it seems to be empty)OT: Overtime lossesP: PointsP%: Points PercentageRW: Regulation WinsROW: Regulation + Overtime WinsGF: Goals ForGA: Goals AgainstGF/GP: Goals For per Game PlayedGA/GP: Goals Against per Game PlayedPP%: Power Play PercentagePK%: Penalty Kill PercentageNet PP%: Net Power Play PercentageNet PK%: Net Penalty Kill PercentageShots/GP: Shots per Game PlayedSA/GP: Shots Against per Game PlayedFOW%: Faceoff Win Percentage
After this initial summary of the data from the CSV file, Chat GPT then proceeded with a descriptive analysis looking across the data. What was interesting here is that it called out why there were no values in the Ties column.
Let's proceed with a more detailed analysis, such as the data's descriptive statistics, missing values, and potential correlations between the variables.
Here are the descriptive statistics for the dataset:
- There are 32 unique teams, all from the same season (2022-2023).
- The average number of games played (GP) is 82 for all teams, which indicates a full season.
- The average number of wins (W) is about 41, with a minimum of 22 and a maximum of 65.
- The average number of losses (L) is approximately 32, with a range from 12 to 49.
- The 'T' column is filled with '--', indicating no ties occurred during the season. This is in line with the NHL's current rules, where games are decided in overtime or a shootout, eliminating ties.
- The average number of overtime losses (OT) is around 9, with a range from 3 to 17.
- The mean points percentage (P%) is approximately 0.56, which represents the proportion of points the team earned out of the total points they could have earned.
- The average goals for (GF) and goals against (GA) per game played are both around 3.14.
- The average power play percentage (PP%) is 21.1%, and the average penalty kill percentage (PK%) is 78.7%.
Regarding missing data, there are no missing values in this dataset. This is good news as it means we don't need to do any data imputation or drop any rows due to missing data.
The final part of the analysis from our prompt was a correlation analysis to understand if there were any relationships one can draw across the different team statistics.
Next, let's look at the correlation between variables to understand the relationships among them.
The correlation matrix provides a way to understand the relationships between different variables. Correlation values range from -1 to 1. A value close to 1 indicates a strong positive correlation, a value close to -1 indicates a strong negative correlation, and a value close to 0 indicates a weak or no correlation.
Here are some observations from the correlation matrix:
There's a strong positive correlation between W (Wins) and P (Points), P% (Points Percentage), RW (Regulation Wins), and ROW (Regulation + Overtime Wins). This is expected as more wins lead to more points and a higher points percentage.
L (Losses) is strongly negatively correlated with P (Points), P% (Points Percentage), RW (Regulation Wins), and ROW (Regulation + Overtime Wins). This also makes sense, as more losses would mean fewer points and lower points percentage.
GF (Goals For) and GA (Goals Against) are strongly negatively correlated, indicating that teams who score more tend to concede fewer goals.
PP% (Power Play Percentage) and GF (Goals For) have a strong positive correlation. Teams with a higher power play percentage tend to score more goals.
PK% (Penalty Kill Percentage) and GA (Goals Against) are strongly negatively correlated. A higher penalty kill percentage means a team is more successful at preventing goals while a player is serving a penalty, which in turn is associated with fewer goals against.
Shots/GP (Shots per Game Played) is positively correlated with GF (Goals For). This suggests that teams who take more shots tend to score more goals.
SA/GP (Shots Against per Game Played) is positively correlated with GA (Goals Against), indicating that teams who face more shots tend to concede more goals.
These correlations provide insights into the dynamics of hockey games and the factors that contribute to a team's success. However, it's important to remember that correlation does not imply causation, and these relationships could be influenced by other factors not included in this dataset.
The correlations from Chat GPT were pretty interesting and can give you signals as to where you might do some additional analyses – either through Chat GPT or in your own environment.
Summary
Through the walkthrough, hopefully you can see that there are definitely some benefits to building AI into your hockey analytics tools and processes. This was a very simple prompt with Chat GPT, and the AI engine uncovered interesting insights for us to explore further.
What's also good about Chat GPT is that you can use it for learning – whether you're searching for concepts, statistical calculations and formulae or coding suggestions in your favorite language. The natural language interaction with Chat GPT (and what will be many other flavors of generative AI to follow) provides a much more complete and intuitive way to get answers for your questions.
AI, though, is very broad, so Chat GPT while in a good hype cycle is a fraction of what's out there for you to use. For example, if you're a professional team looking to implement AI, you will need to build data pipelines from one or more data sources, data processing layers to wrangle and normalize data, custom views across raw and prepared data, and customize reporting layers. It's within this environment where you will build your AI or machine-learning algorithms – which will typically sit close to where the data is being processed. Deploying the data engineering pipelines/layers and infrastructure (Cloud-based or otherwise) and then implementing your AI on top of the data layer(s) is time intensive and requires skills and expertise to manage.
So, be sure to differentiate between consumer-based hockey analytics (i.e., the hockey analytics hobbyist) versus the IT department of a professional sports club/league who may employ several people and specific skill sets to implement and maintain their data and AI environments. And so while AI has its benefits, there is a lot of work that goes into scaling it from the hobbyist all the way to the organization.
We'll continue to highlight areas where we think AI is relevant in future lessons.
Subscribe to our newsletter to get the latest and greatest content on all things hockey analytics!
Member discussion